
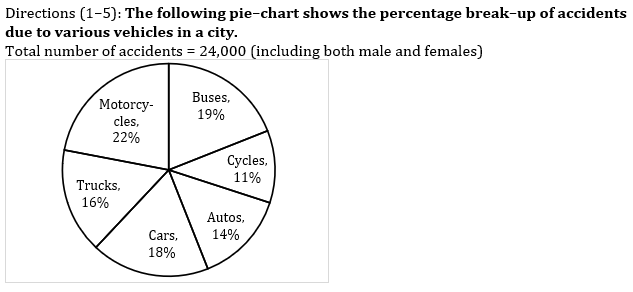
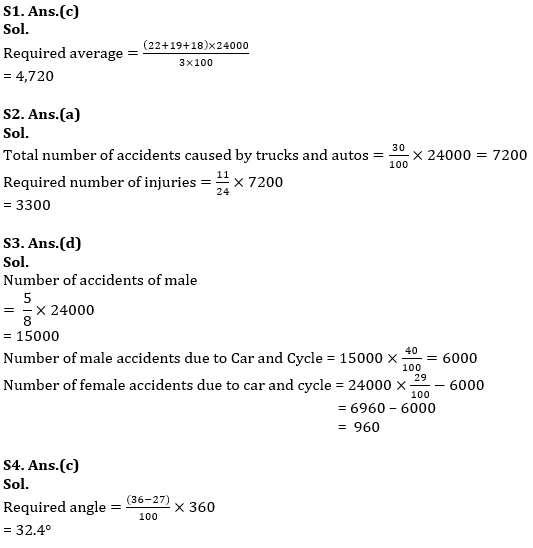
Q1. Find the average number of accidents that are due to motorcycles, Buses and cars?
(a) 4,620
(b) 4,820
(c) 4,720
(d) 4,520
(e) 4,500
Q2. Out of the total number of accidents caused by trucks and autos together , the ratio of Death to Injuries is 13 : 11. Then find the number of injuries caused by these two vehicles.
(a) 3,300
(b) 3,900
(c) 4,400
(d) 3,410
(e) 3,850
Q3. If in total number of accidents 62½% are male. Male accidents due to cars and cycles is 40% of total male accidents, then find the number of female accidents due to cars and cycles together?
(a) 720
(b) 900
(c) 600
(d) 960
(e) 840
Q4. Find the difference of the central angle corresponding to the number of accidents due to motorcycles and autos together and Trucks and cycles together.
(a) 35°
(b) 33.4°
(c) 32.4°
(d) 35.4°
(e) 36°
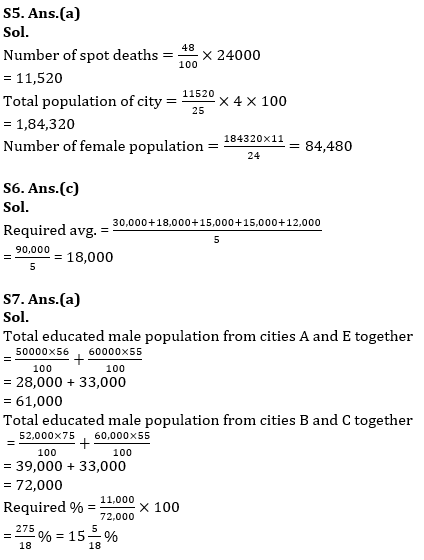
Q5. Out of total accidents, 48% are resulted into spot deaths, which are only 6¼% of the total population of city. Then, find the number of female population, if the ratio of male to female is 13 : 11 in the city.
(a) 84,480
(b) 82,480
(c) 86,480
(d) 86,640
(e) 84,680
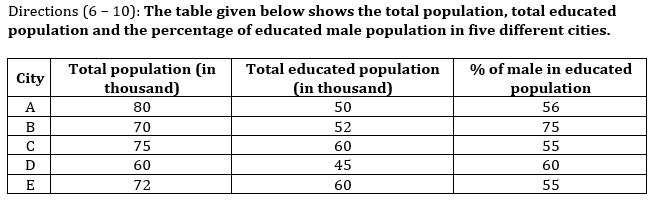
Q6. Find the average of the uneducated population of all the five cities ?
(a) 16,000
(b) 16,500
(c) 18,000
(d) 17,000
(e) 18,500
Q7. Total population of educated male from cities A and E together is what percent more or less than the total educated male population from cities B and C together ?
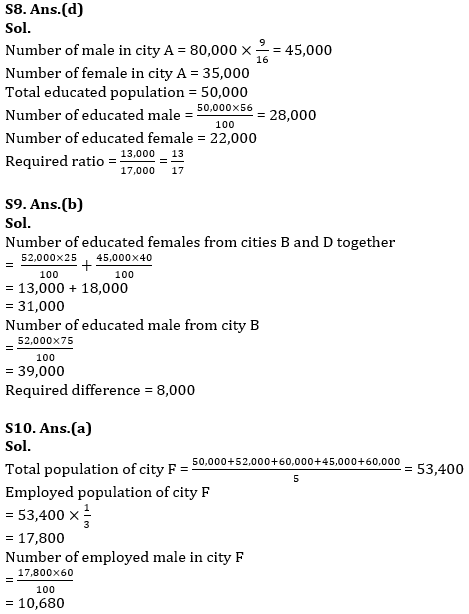
Q8. If the ratio of male to female in city A is 9 : 7. Then find the ratio of the uneducated female population to the uneducated male population in city A.
(a) 17 : 13
(b) 13 : 16
(c) 16 : 13
(d) 13 : 17
(e) 12 : 17
Q9. Find the difference between the number of educated females from cities B and D together to the number of educated males from city B.
(a) 6,000
(b) 8,000
(c) 5,500
(d) 7,000
(e) 6,500
Q10. The total population of city F is equal to the average of educated population of all the five cities. In city F, 66⅔% of total population are unemployed and 40% of the employed population are females. Then find the number of employed male in city F.
(a) 10,680
(b) 10,480
(c) 10,780
(d) 10,880
(e) 10,580
Directions (11-15): The following table shows the data related to the employment situation in a city in the five different years. If also shows the total population of city in given years, percentage of Govt. Employees, Pvt. Employees and out of remaining, the ratio between number of self-employed person to the number of unemployed person. Read the data carefully and answer the questions.
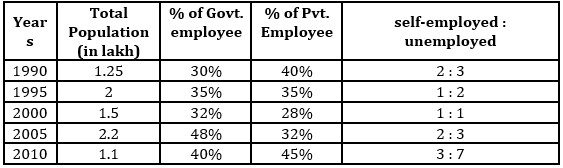
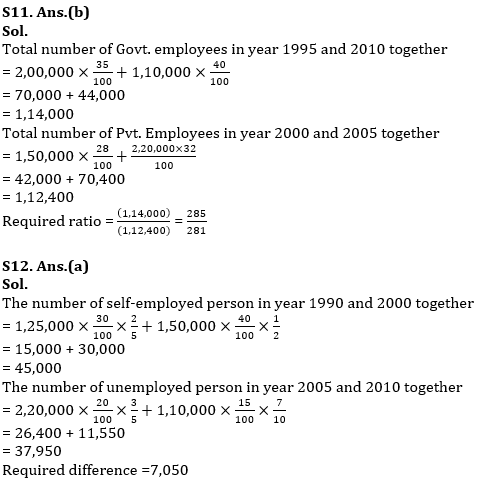
Q11. Find the ratio between total number of Govt. employees in year 1995 and 2010 together to total number of Pvt. Employees in year 2000 and 2005 together?
(a) 95 : 128
(b) 285 : 281
(c) 275 : 271
(d) 517 : 570
(e) 575 : 517
Q12. Find the difference between total number of self-employed person in year 1990 and 2000 together and the number of unemployed person in year 2005 and 2010 together.
(a) 7050
(b) 7250
(c) 6850
(d) 7150
(e) 6950
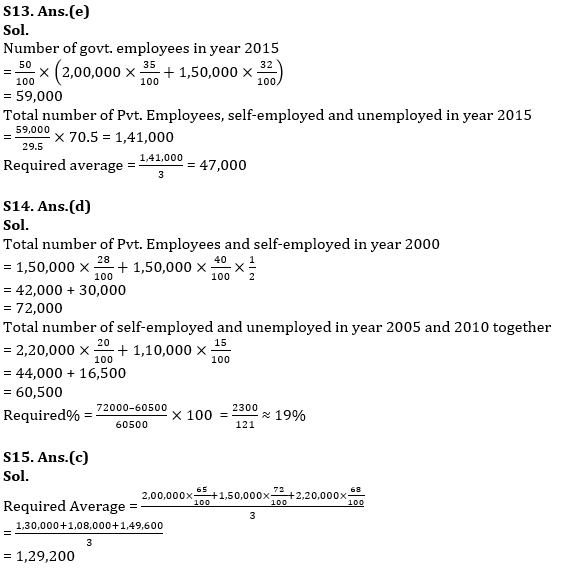
Q13. Find the average number of Pvt. employees, self-employed and unemployed in year 2015 if total number of Govt. employees in 2015 is equal to 50% of the total number of govt. employee in year 1995 and 2000 together and in year 2015, 29½% of the total employees are Govt. employees.
(a) 94,000
(b) 46,000
(c) 47,500
(d) 46,500
(e) 47,000
Q14. The total number of Pvt. employees and self-employed in year 2000 is approximately what percent more than the total number of self-employed and unemployed person in year 2005 and 2010 together?
(a) 15%
(b) 12%
(c) 22%
(d) 19%
(e) 25%
Q15. Find the average population of city in the year 1995, 2000 and 2005 together excluding number of Pvt. Employees in all these years?
(a) 1,25,800
(b) 1,27,400
(c) 1,29,200
(d) 1,31,200
(e) 1,33,500
Practice More Questions of Quantitative Aptitude for Competitive Exams:
Solutions

Click Here to Register for Bank Exams 2021 Preparation Material


 General Awareness Quiz for Bank Mains Ex...
 English Language Quiz For Bank Foundatio...
 Reasoning Quiz For Bank Foundation 2024 ...


