

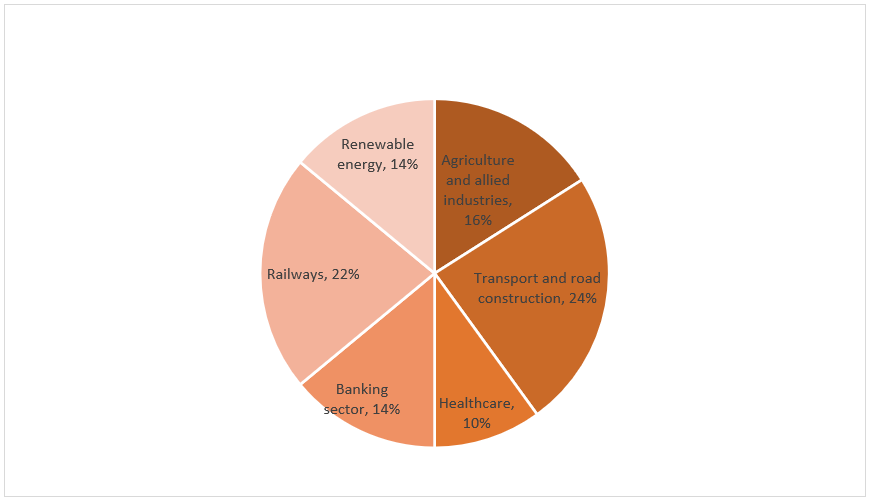
Directions (1-5): Given below the pie chart which shows the distribution of budget allotted by the government for six sectors in 2016. Read the graph carefully and answer the following questions.
 Note :
(i) Total budget allotted in 2016 and 2017 is in the ratio of 3 : 4 (in lakh cr)
(ii) The percentage distribution for all the six sectors remains same in both the years.
Quantitative Quiz For IDBI AM/Executive 2022 27th June CHECK IN HINDI
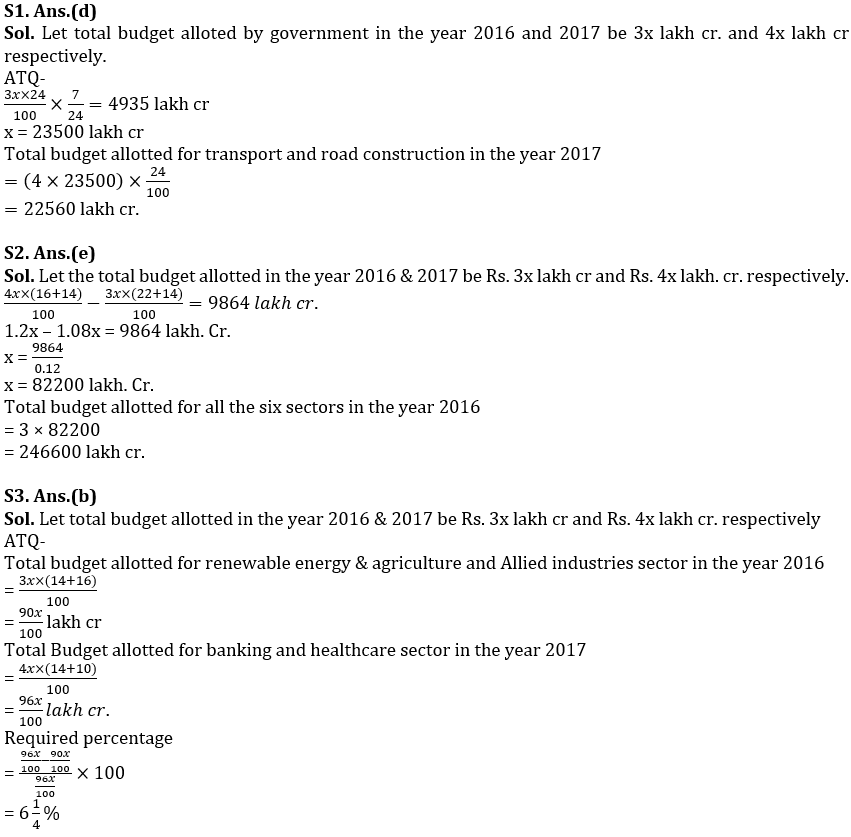
Q1. The total budget allotted for transport and road construction sector in the year 2016 is further distributed in the construction of National Highway, bridges and rural road in the ratio of 9 : 8 : 7.If the budget used for rural road construction in the year 2016 is Rs 4935 lakh cr.Then find the total budget allotted for Transport and road construction sector in the year 2017(in lakh crore)?
(a) 23500
(b) 23560
(c) 22500
(d) 22560
(e) 23250
Q2. If the total budget allotted for Agriculture and allied industries & banking sector in the year 2017 is 9864 lakh cr. more than the budget allotted for Railways & Renewable energy sector in the year 2016.Then find the total budget allotted for the all the six sectors in the year 2016?
(a) 246060
(b) 246200
(c) 246800
(d) 246000
(e) 246600
Q3. Total budget allotted for Renewable energy, agriculture and allied industries sector in the year 2016 is what per cent less than the total budget allotted for banking & Healthcare sector in the year 2017?
(a) 4 ¼ %
(b) 6 ¼ %
(c) 8 ¼ %
(d) 10 ¼ %
(e) 2 ¼ %
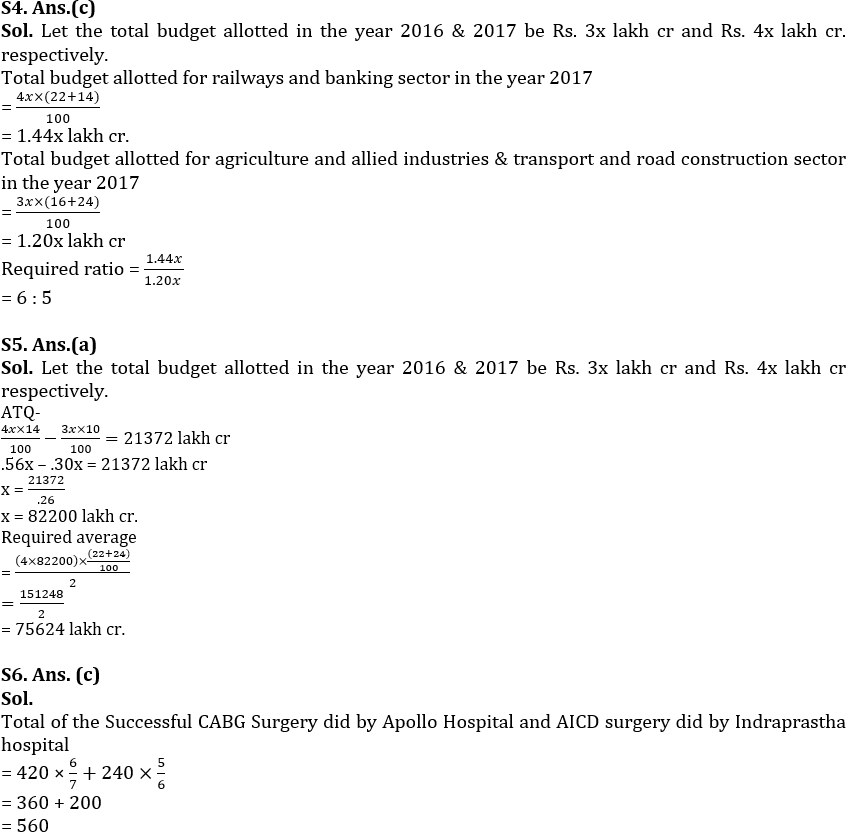
Q4. Find the ratio between the total budget allotted for railways & banking sector in the year 2017 to the total budget allotted for agriculture and allied industries & transport and road construction sector in the year 2016?
(a) 4 : 5
(b) 5 : 6
(c) 6 : 5
(d) 4 : 3
(e) 3 : 4
Q5. Budget allotted for banking sector in the year 2017 is Rs. 21372 lakh cr more than the budget allotted for healthcare sector in 2016. Find the average of the total budget allotted for railway & transport and road construction sector in the year 2017?
(a) 75624
(b) 75264
(c) 75462
(d) 75662
(e) 75684
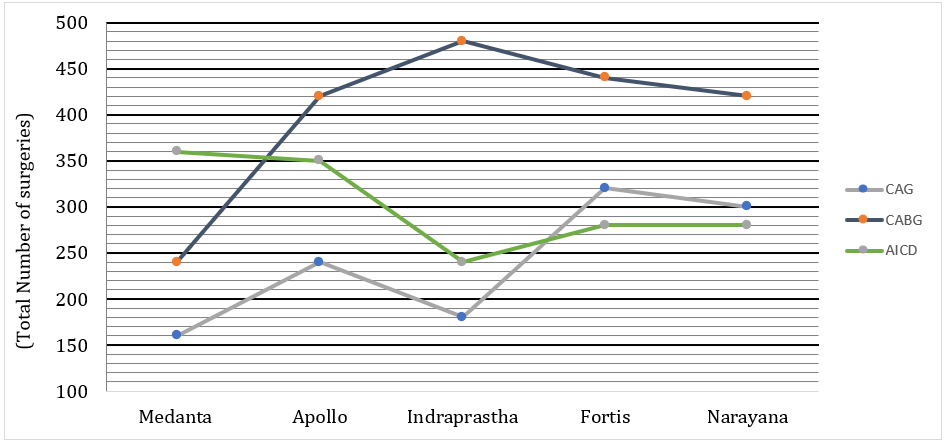
Directions (6-10): Given below is the line graph which shows the total three types of heart surgeries did by five different hospitals of India. Read the graph carefully and answer the following questions:
Q6. If ![]() of the total CABG surgeries did by Apollo hospital and 16 ⅔% of the total AICD surgery did by Indraprastha hospital are unsuccessful then find the total number of the successful CABG & AICD surgeries done by these two hospitals respectively?
of the total CABG surgeries did by Apollo hospital and 16 ⅔% of the total AICD surgery did by Indraprastha hospital are unsuccessful then find the total number of the successful CABG & AICD surgeries done by these two hospitals respectively?
(a) 540
(b) 566
(c) 560
(d) 572
(e) 596
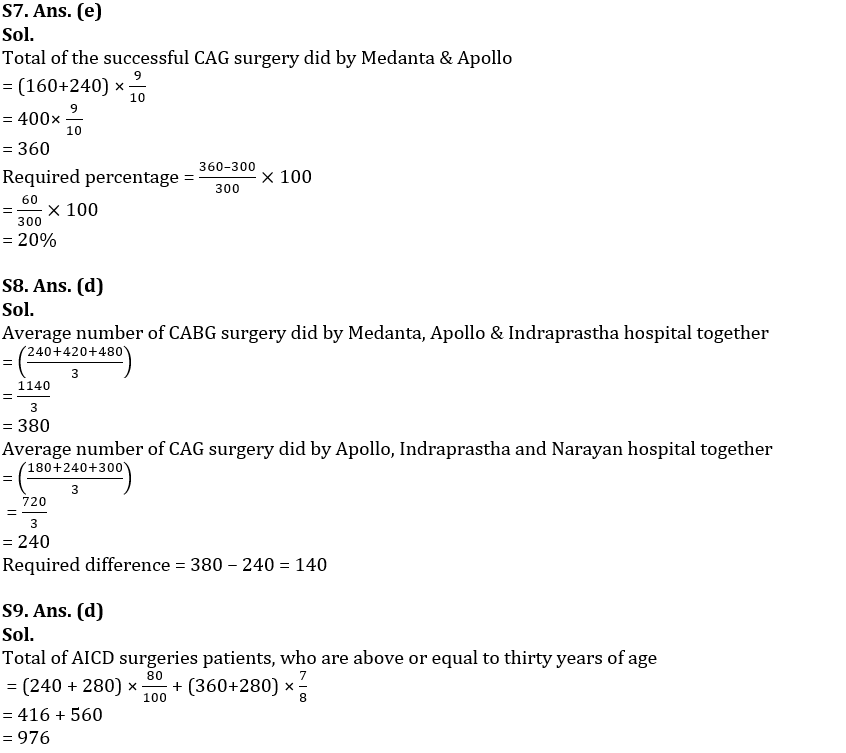
Q7. If the ratio between the successful CAG surgery done by Medanta and Apollo together to the unsuccessful CAG surgery done by Medanta & Apollo together is 9 : 1 then the total of the successful CAG surgery did by Medanta & Apollo together is what percent more than total CAG surgery did by Narayana?
(a) 15%
(b) 25%
(c) 30%
(d) 8%
(e) 20%
Q8. Find the difference between the average number of CABG surgery did by Medanta, Apollo & Indraprastha hospital together and the average number of CAG surgery did by Apollo, Indraprastha & Narayana hospital together?
(a) 144
(b) 156
(c) 164
(d) 140
(e) 180
Q9. Out of the total AICD surgeries did by Indraprastha & Fortis hospital together, 20% of the patients are below thirty years of age and out of the total AICD surgeries did by Medanta and Narayana together, 12 ½ % of patients are below thirty years of age. Find the number of total patients for AICD surgeries, who are above or equal to the thirty years of age?
(a) 978
(b) 965
(c) 945
(d) 976
(e) 948
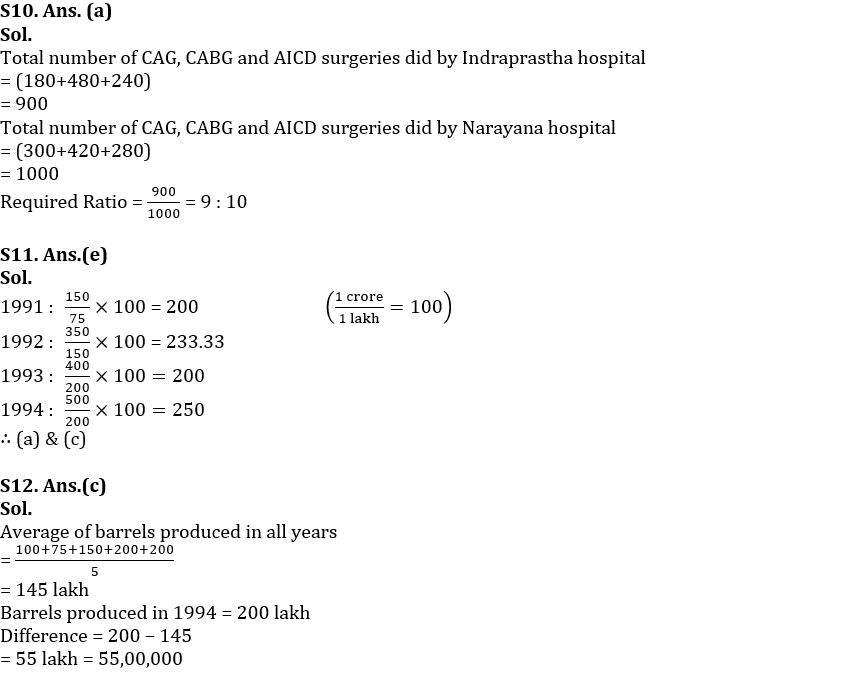
Q10. Find the ratio between the total number of CAG, CABG and AICD surgeries did by Indraprastha hospital to the total number of CAG, CABG and AICD surgeries did by Narayana hospital?
(a) 9 : 10
(b) 10 : 9
(c) 9 : 11
(d) 11 : 9
(e) 9 : 13
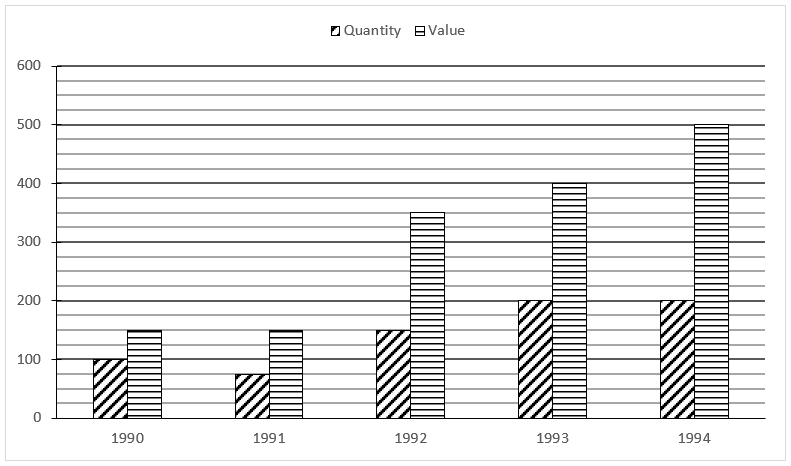
Directions (11-15): The following graph shows the quantity of refined oil produced in lakh of barrels and value in crores of rupees.
Q11. In which year the value oil produced per barrel was minimum (among the options given below) ?
(a) 1991
(b) 1992
(c) 1993
(d) 1994
(e) both (a) and (c)
Q12. What is the difference between the average number of oil barrels produced in all years and the number of oil barrel produced in 1994?
(a) 65,00,000
(b) 7,50,000
(c) 55,00,000
(d) 4,50,000
(e) 6,50,000
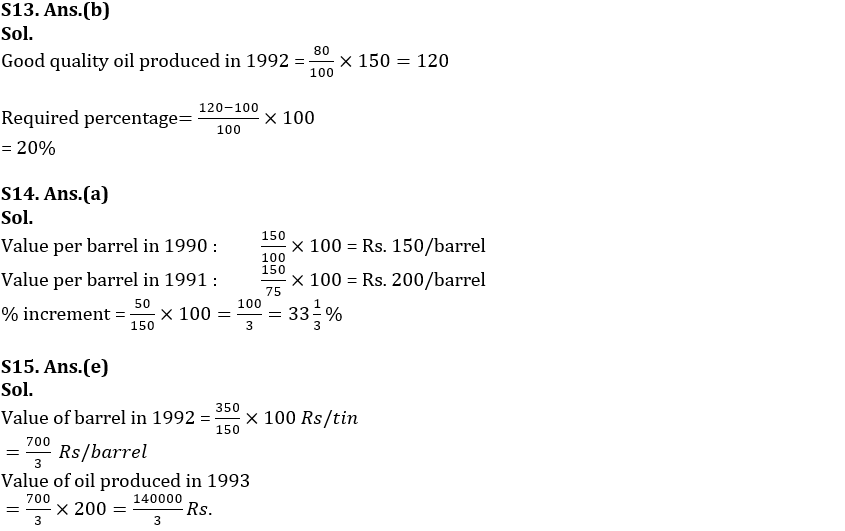
Q13. If 20% of oil produced in year 1992 is of bad quality and remaining is of good quality then, good quality oil produced in 1992 is what percent more/less than oil produced in year 1990
(a) 15%
(b) 20%
(c) 18%
(d) 14%
(e) 12%
Q14. What was the percentage increase in value of oil produced per barrel from1990 to 1991?
(a) 33⅓%
(b) 40%
(c) 30%
(d) 66 ⅔%
(e) 20%
Q15. If in 1993, oil was produced at the same rate per barrel as of in 1992, then what would be the value of whole oil produced in 1993
(a) 16000/3
(b) 15000/3
(c) 13000/3
(d) 19000/3
(e) 140000/3
Solutions


 Data Interpretation Questions for IBPS R...
 Data Interpretation Questions For Bank E...
 Data Interpretation Questions for SBI PO...


