
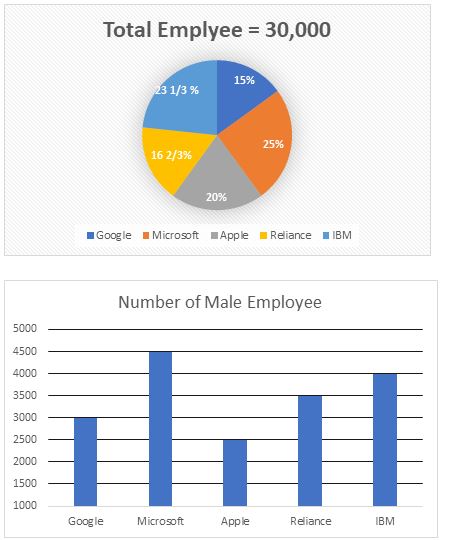
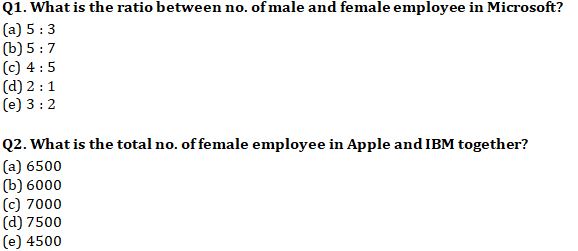
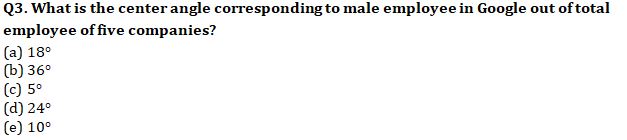
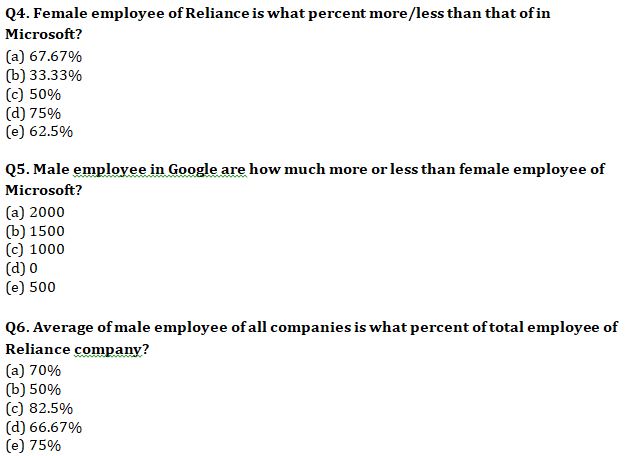
Directions (1-6):- The pie chart given below shows the percentage distribution of total employees of five different companies and bar graph shows the no. of male employee of given companies. Study the graphs carefully and answer the following questions.
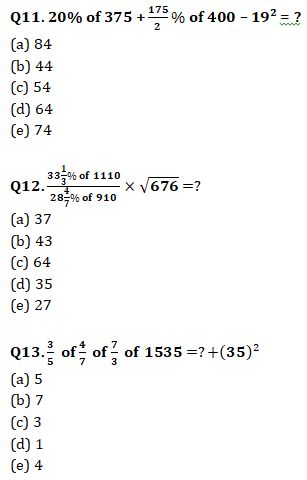
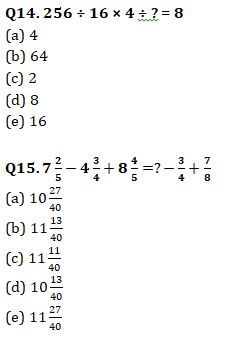
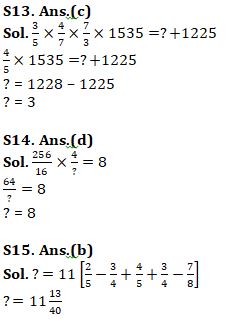
Directions (11-15): – Simplify the following equations and find the value of (?) question mark?
Practice More Questions of Quantitative Aptitude for Competitive Exams:
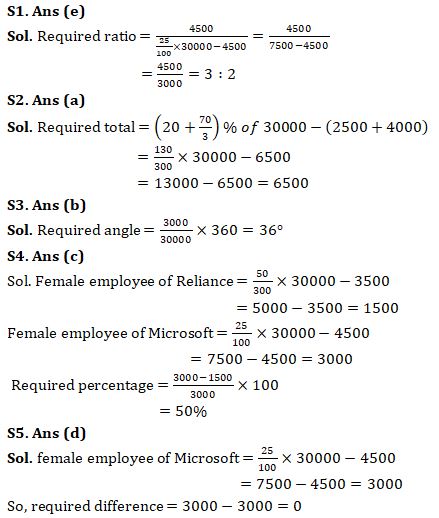
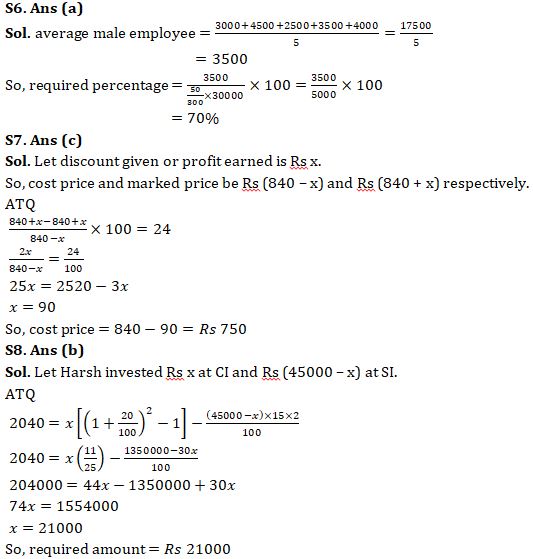
Solutions
![]()
Practice with Online Test Series for RBI Attendant 2021:
Click Here to Register for Bank Exams 2020 Preparation Material


 GA Questions Asked In RBI Assistant Main...
 RBI Assistant Mains Memory Based Paper 2...
 RBI Assistant Mains Exam Analysis 2026, ...


