

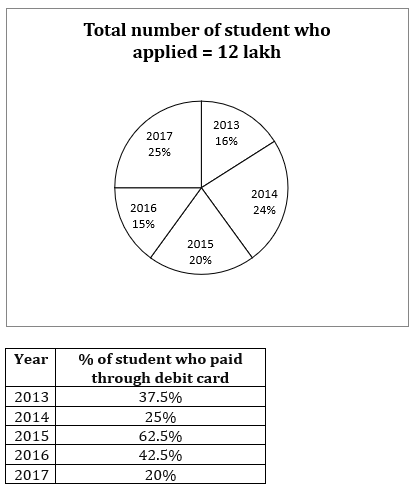
Directions (1-5): Study the following pie-chart and answer the questions.
Pie-chart given below shows the percentage distribution of students who applied for IBPS exam in 5 different years. And table shows the percentage of student who paid the fees by debit card.
Note: Fees is paid only through debit and credit card.
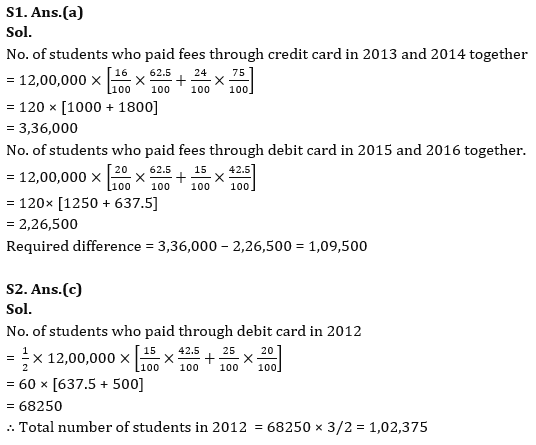
Q1. Number of students who paid their fees through credit card in year 2013 and 2014 together is how much more/less than number of students who paid through debit card in year 2015 and 2016 together?
(a) 109500
(b) 112500
(c) 109600
(d) None of these
(e) 129500
Q2. Number of students who paid through debit card in 2012 is equal to average of students who paid through debit card in 2016 and 2017 and students who paid through debit card is ⅔rd of total student in 2012. Then find total students in 2012?
(a) None of these
(b) 1,04,225
(c) 1,02,375
(d) 1,22,345
(e) 1,11,320
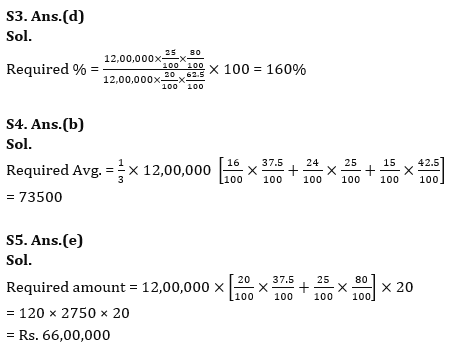
Q3. Students who paid fees through credit card in 2017 is what percent of students who paid fees through debit card in 2015?
(a)110%
(b)175%
(c)125%
(d)160%
(e)None of these
Q4. Find the average number of students who paid their fees through debit card in year 2013, 2014 and 2016?
(a)71250
(b)73500
(c)75300
(d)None of these
(e)71750
Q5. If the fees is paid through credit card then each student has to pay Rs. 20 extra inclusive of fees. Then find the total extra amount paid by students in year 2015 and 2017 together?
(a)58 lakh
(b)54 lakh
(c)None of these
(d)68 lakh
(e)66 lakh
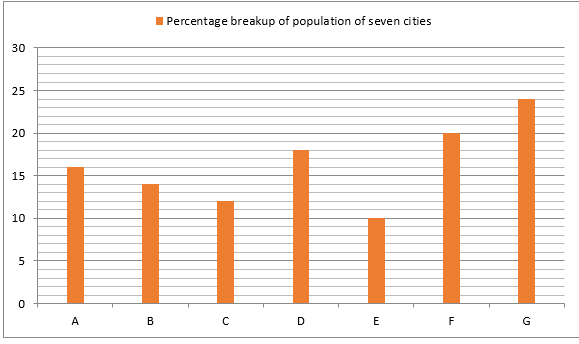
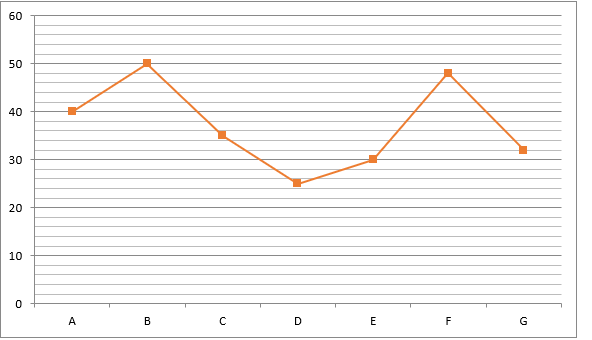
Direction (6 -10): Given below bar graph shows percentage breakup of population of six cities (A, B, C, D, E, F) and population of G given in absolute value (in hundred), while line graph shows percentage of illiterate population in each cities. Read the data carefully and answer the question.
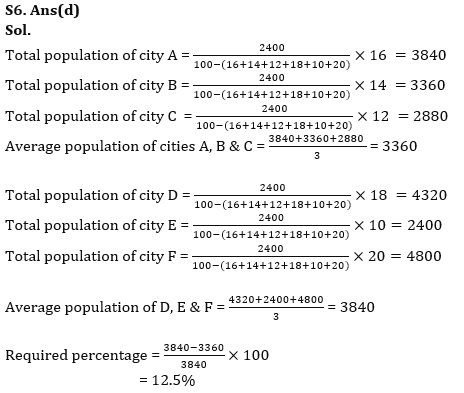
Q6. The average population of cities A, B & C is what percent less than the average population of cities D, E & F?
(a) 7.5%
(b) 10%
(c) 12%
(d) 12.5%
(e) 16%
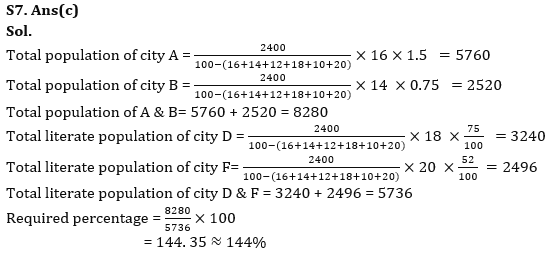
Q7. If total population of city A is increased by 50%, and population of city B is decreased by 25%, then find total population of cities A & B together is approximately what percent of total literate population of cities D & F together?
(a) 148%
(b) 128%
(c) 144%
(d) 138%
(e) 150%
Q8. Total illiterate population of cities B & D together is how much less than total literate population of cities A & F together?
(a) 1880
(b) 2040
(c) 2404
(d) 2208
(e) 2200
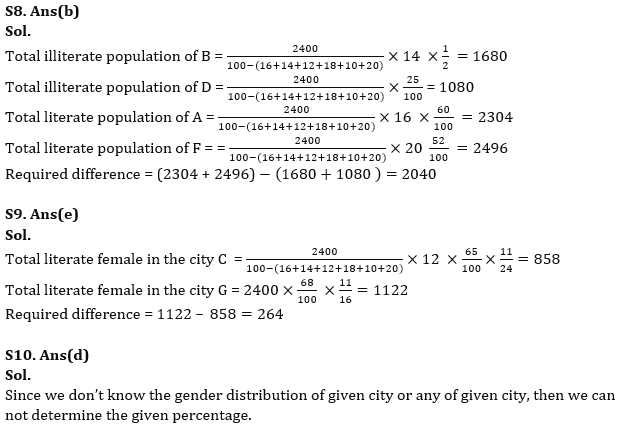
Q9. The ratio of literate male to literate female in city C is 13 : 11 and that in city G is 5 :11, then find difference between literate female in both the cities?
(a) 288
(b) 240
(c) 256
(d) 244
(e) 264
Q10. Total illiterate male in the city E is 36% of total literate male in city D, then find the total illiterate female in city E is what percent of total literate female in city D?
(a) 18%
(b) 16%
(c) 26%
(d) Can’t be determined
(e) 32%
Solutions


 Quantitative Aptitude Quiz For Bank Main...
 Quantitative Aptitude Quiz For Bank Foun...


