
Directions (1 – 5): Bar graph given below shows number of students (in’000) who joined Adda247 for Bank, SSC, Railway in five different years
Study the following graph carefully and answer the questions that follows
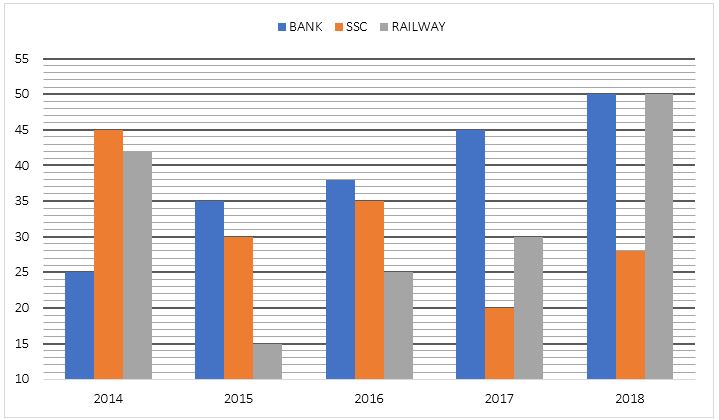
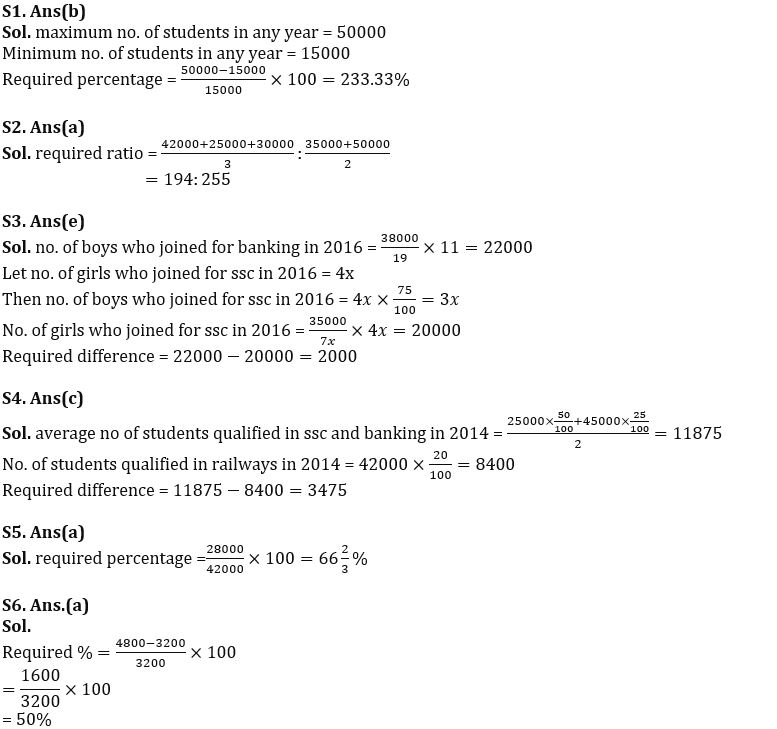
Q1. Maximum no. of students is how much percent more than minimum no. of students in any year who joined for banking, ssc and railways?
(a) 266.67%
(b)233.33%
(c)266.33%
(d)267.66%
(e)233.67%
Q2. What is the ratio of average no. of students who joined for railway in 2014, 2016 and 2017 to average no. of students who joined for banking in year 2015 & 2018?
(a)194:255
(b)97:117
(c)117:97
(d)177:194
(e)None of these.
Q3. If ratio of boys to girls in banking in year 2016 is 11:8 and no. of boys are 25% less than that of girls in ssc in same year, then find the difference between no. of boys in banking and no. of girls in ssc in 2016?
(a)3000
(b)4000
(c)7000
(d)2500
(e)2000
Q4. In 2014 no. of students qualified in exam are 50%, 25% and 20% in banking, ssc and railways respectively out of total students who joined Adda247 for banking, ssc & railways in 2014 respectively. Find average no. of students qualified in banking and ssc in 2014 are how much more than who qualified in railway in 2014?
(a)3425
(b)3405
(c)3475
(d)3450
(e)3440
Q5. No. of student who joined for ssc in 2018 are what percent of number of students who joined for railway in 2014?
(a) 66⅔%
(b) 33⅔%
(c) 33⅓%
(d) 66⅓%
(e)None of these.
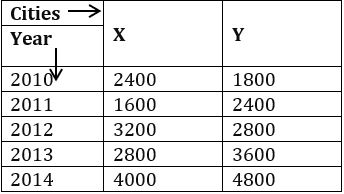
Directions (6-10): Table given below shows population of two cities in five different years. Study the data carefully & answer the follow questions.
Q6. Population of city Y is 2014 is what percent more the population of city X in 2012?
(a) 50%
(b) 40%
(c) 60%
(d) 55%
(e) None of these
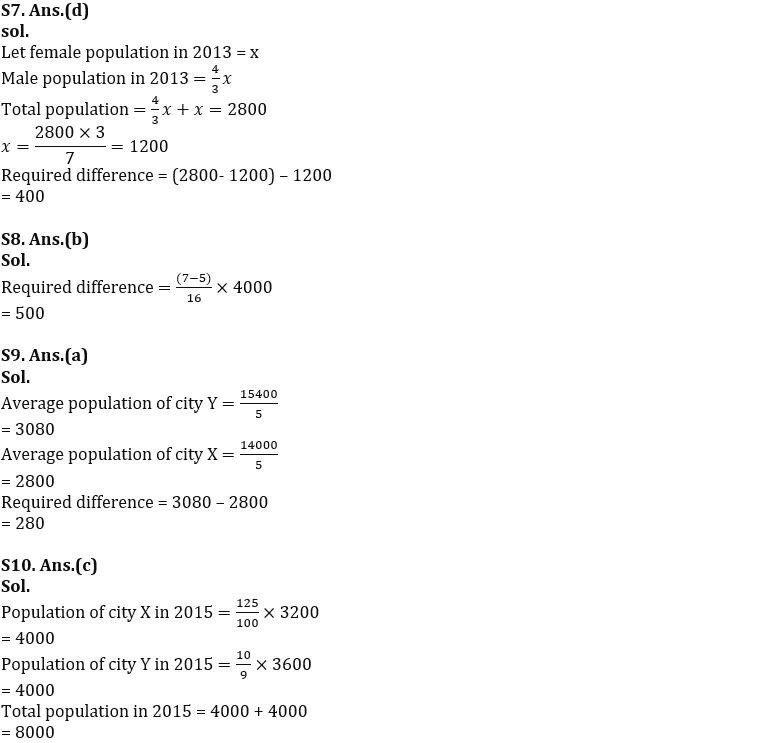
Q7. Male population of city X in 2013 is 33⅓% more than female population of city X in 2013. Find the difference b/w male population & female population city of X in 2013?
(a) 350
(b) 360
(c) 380
(d) 400
(e) 420
Q8. Total population of X and Y in 2011 divided into three categories i.e., male, female & transgender in the ratio 7 : 5 : 4. Find the difference b/w the male population & female population in 2011.
(a) 450
(b) 500
(c) 480
(d) 420
(e) 250
Q9. Average population of city Y in five year is how much more than the average population of city X in five years.
(a) 280
(b) 250
(c) 270
(d) 240
(e) 300
Q10. Population of city X in 2015 is 25% more than population of city X in 2012 and population of city Y in 2015 is ![]() more than population of city Y in 2013. Find total population of both cities in year 2015.
more than population of city Y in 2013. Find total population of both cities in year 2015.
(a) 7000
(b) 7500
(c) 8000
(d) 8500
(e) 9000
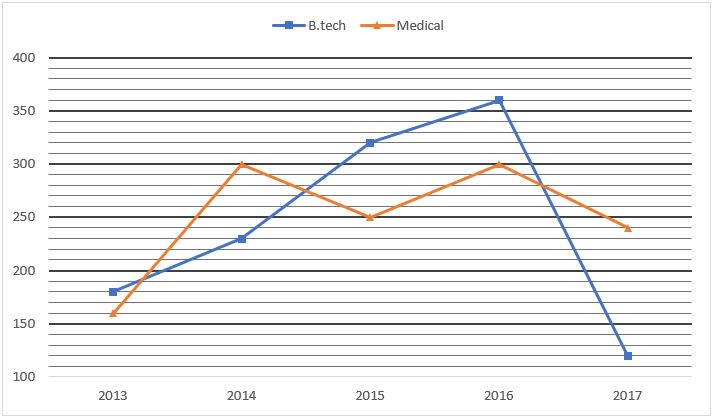
Direction (11-15): The following line graph shows the number of students enrolled in two different courses (B.Tech, & Medical) in a college during 2013 to 2017. Study the given graph carefully and answer the following questions.
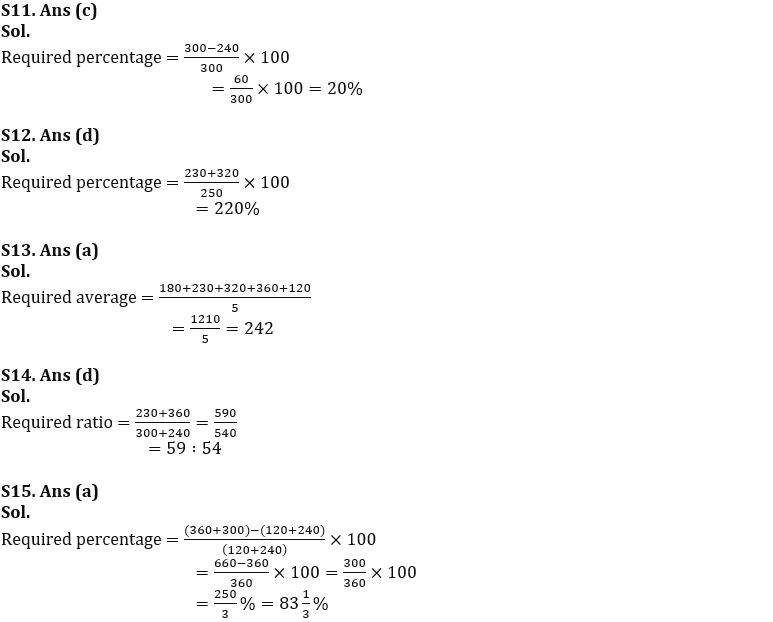
Q11. What was the percent increase/decrease in number of students in medical in the year 2017 as compared to previous year?
(a) 12.5%
(b) 25%
(c) 20%
(d) 22.5
(e) 33.33%
Q12. Number of students enrolled in B.Tech in the year 2014 and 2015 together was what percent of the total number of students enrolled in Medical in the year 2015?
(a) 500/11%
(b) 120%
(c) 150%
(d) 220%
(e) 70%
Q13. Find the average no. of students enrolled in B.Tech all over the years.
(a) 242
(b) 422
(c) 264
(d) 342
(e) 282
Q14. What is the ratio between students enrolled in B.tech in year 2014 and 2016 together to that of Medical in year 2017 and 2016 together?
(a) 54 : 59
(b) 9 : 10
(c) 55 : 58
(d) 59 : 54
(e) 57 : 59
Q15. Total number of students enrolled in year 2016 is how much percentage more or less than total no. of students enrolled in year 2017? (Total students = medical + B-tech)
(a) 83⅓%
(b) 85⅓%
(c) 87⅔%
(d) 90 %
(e) 93 ⅓%
Solutions


 Data Interpretation Questions for IBPS R...
 Data Interpretation Questions For Bank E...
 Data Interpretation Questions for SBI PO...


