

Directions (1-5): Study the following bar-graph carefully to answer the following questions.
Bar-graph shows number of books sold by three shopkeepers i.e. X, Y and Z in thousands in 5 different years.
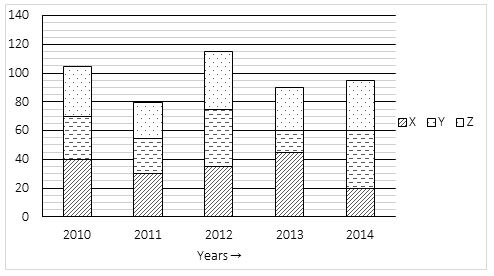
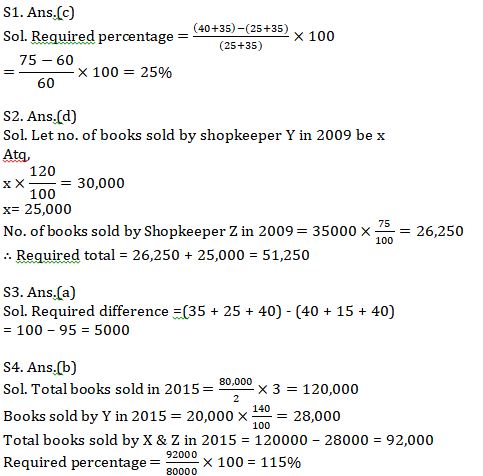
Q1. No. of books sold by Shopkeeper X in year 2010 and 2012 together is what percent more/less than total no. of books sold by shopkeeper Z in year 2011 and 2014 together?
(a) 40%
(b) 30%
(c) 25%
(d) 35%
(e) 20%
Q2. No. of books sold by shopkeeper Y in 2010 is 20% more than no. of books sold in 2009 and no. of books sold by shopkeeper Z in 2009 is 25% less than that of sold in 2010. Then find no. of total books sold by Y and Z in 2009?
(a) 52,000
(b) 54,150
(c) 52,250
(d) 51,250
(e) 50,750
Q3. What is difference between total no. of books sold by shopkeeper Y in year 2012, 2013 and 2014 together and by shopkeeper Z in year 2010, 2011 & 2012 together?
(a) 5000
(b) 7000
(c) 4500
(d) 6000
(e) 5500
Q4. Ratio of total no. of books sold in year 2011 to that sold in 2015 is 2 : 3 and no. of books sold by Y in 2015 is 40% more than no. of books sold by X in 2014. Then total no. of books sold by X & Z together in 2015 is what percent of the total no. of books sold in 2011?
(a) 120%
(b) 115%
(c) 145%
(d) 105%
(e) 130%
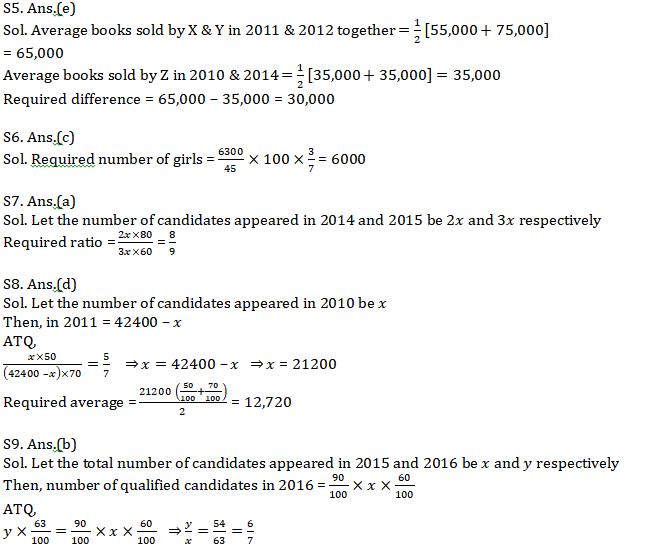
Q5. Average no. of total books sold by Y and X together in both the year 2011 and 2012 are how much more/less than average no. of books sold by Z in year 2010 and 2014 together?
(a) 15000
(b) 35000
(c) 25000
(d) 40000
(e) 30000
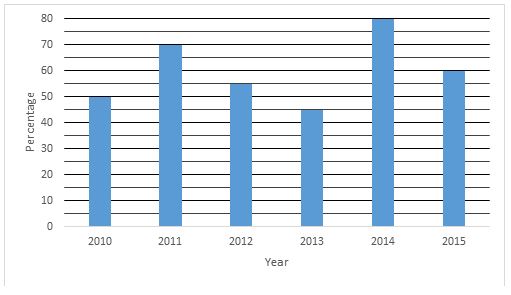
Directions (6-10): Study the following bar graph and answer the following questions.
The following bar graph gives the percentage of the number of candidates who qualified an examination out of the total number of candidates who appeared for the examination over a period of six years from 2010 to 2015.
Q6. If the number of candidates qualified in 2013 was 6300, then what was the number of girls appeared in 2013, if the ratio between number of boys to girls who appeared is 4 : 3.
(a) 4,500
(b) 5,400
(c) 6,000
(d) 6,300
(e) 6,600
Q7. If the number of candidates appeared in the examination in 2014 and 2015 were in the ratio of 2 : 3, then find the ratio of qualified candidates in the year 2014 to qualified candidates in the year 2015?
(a) 8 : 9
(b) 2 : 3
(c) 5 : 9
(d) 5 : 6
(e) 10 : 9
Q8. If the total number of candidates appeared in 2010 and 2011 together was 42400 then, find the average number of qualified candidates in these years if the ratio of qualified candidates in 2010 to that in 2011 is 5 : 7.
(a) 11920
(b) 12420
(c) 11720
(d) 12720
(e) 12920
Q9. The number of qualified candidates in 2016 is 90% of the total qualified candidates in 2015 whereas the qualified candidates qualified in 2016 is 63% of the total appeared candidates in 2016. Then find the ratio of appeared candidates in 2016 to that of in 2015.
(a) 5 : 7
(b) 6 : 7
(c) 7 : 6
(d) 8 : 7
(e) 11 : 14
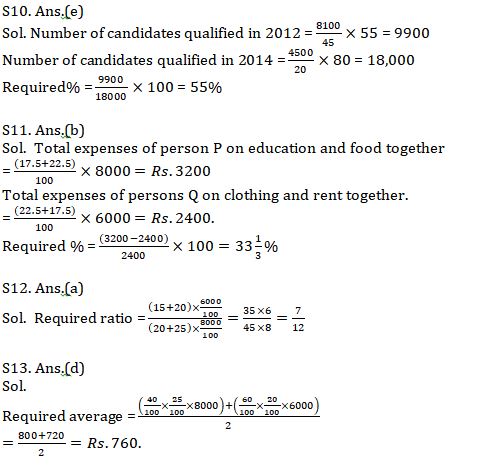
Q10. If number of candidates not qualified in 2012 and 2014 is 8100 and 4500 respectively then find the number of candidates qualified in 2012 is what % of the candidates qualified in 2014.
(a) 58.5%
(b) 50%
(c) 66%
(d) 44%
(e) 55%
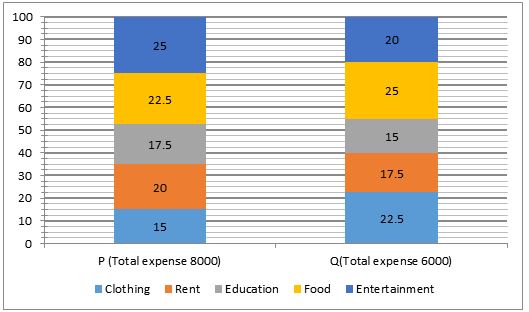
Directions (11-15): The given bar graph shows the expenses of two persons P and Q on various types of expenses in terms of percentage out of total expenses for each person. Total expense of P and Q is Rs8000 and Rs.6000
Q11. Total expenses of person P on Education and Food together is how much percent more/less than the total expenses of person Q on clothing and rent together?
(a) 30%
(b) 33 ⅓%
(c) 25%
(d) 35%
(e) 40%
Q12. What is the ratio of total expenses of person Q on Education and entertainment together to the total expenses of person P on Rent and entertainment together?
(a) 7/12
(b) 2/3
(c) 3/4
(d) 1/2
(e) 5/12
Q13. If 40% of the entertainment expense of person P is on watching movies and 60% of the entertainment expense of person Q is on watching movies then, find the average of total expenses made on movies by both the persons.
(a) Rs. 700
(b) Rs. 600
(c) Rs. 660
(d) Rs. 760
(e) Rs. 750
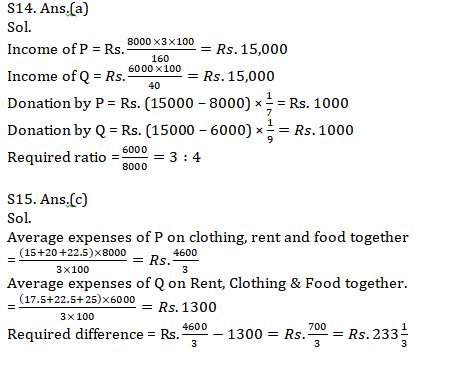
Q15. Find the difference between the average expenses of P on clothing, rent and food together and the average expenses of Q on rent, clothing and Food together?
(a) Rs. 230
(b) Rs. 235
(c) Rs. 233 ⅓
(d) Rs. 235 ⅓
(e) Rs. 243 ⅓
Practice More Questions of Quantitative Aptitude for Competitive Exams:
Solutions

Click Here to Register for Bank Exams 2021 Preparation Material


 RBI Assistant Score Card 2026, Download ...
 IBPS Calendar 2026-27 Out @ibps.in for P...
 HPSCB Junior Clerk Exam Date 2026, Check...


