
Directions (1-5): Given below pie chart shows percentage distribution of population of five village in two different years (2016 & 2017). Read data carefully and answer the questions.
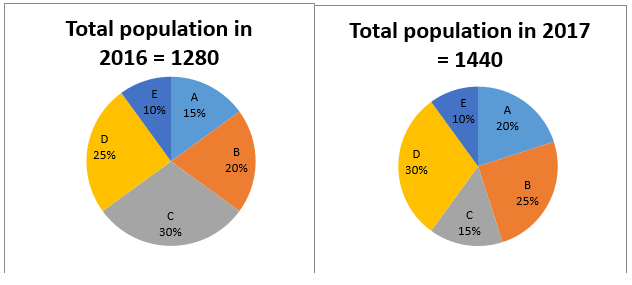
Q1. Find increment percentage of population of village E in the year 2017 over the 2016?
(a) 7.5%
(b) 8.5%
(c) 11.5%
(d) 12.5%
(e) 10.5%
Q2. Find the ratio between total population of village B in the year 2017 to total population of village B & C together in the year 2016?
(a) 8 : 15
(b) 9 : 11
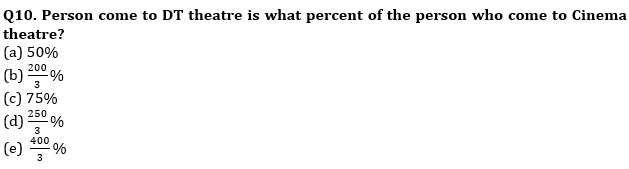
(c) 9 : 17
(d) 9 : 16
(e) 9 : 19
Q3. Find difference between population of village D in the year 2017 and village D in the year 2016?
(a) 112
(b) 110
(c) 108
(d) 104
(d) 112
Q4. Find the average number population of village C in the both given years?
(a) 240
(b) 300
(c) 250
(d) 320
(e) 360
Q5. Find decrement percentage in population of village C in the year 2017 over the year 2016?
(a) 43.75%
(b) 44.75%
(c) 47.25%
(d) 48.75%
(e) 50.25%
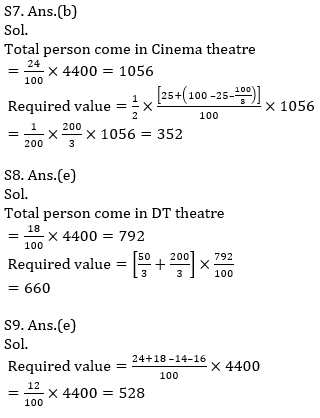
Directions (6-10): Pie-chart given below shows number of persons come to watch movies in five different theaters. Study the data carefully and answer the following questions.
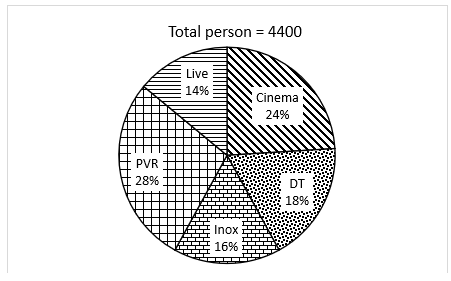
Q6. If Ratio of male and female come in PVR theatre to watch movies is 4 : 7. Then find the difference between number of male to number of female come in PVR theatre to watch movie.
(a) 448
(b) 784
(c) 224
(d) 336
(e) 360
Q9. Find the difference between the person who visit Cinema and DT theatre together to the person who visit LIVE & INOX theatre together?
(a) 462
(b) 484
(c) 506
(d) 352
(e) 528
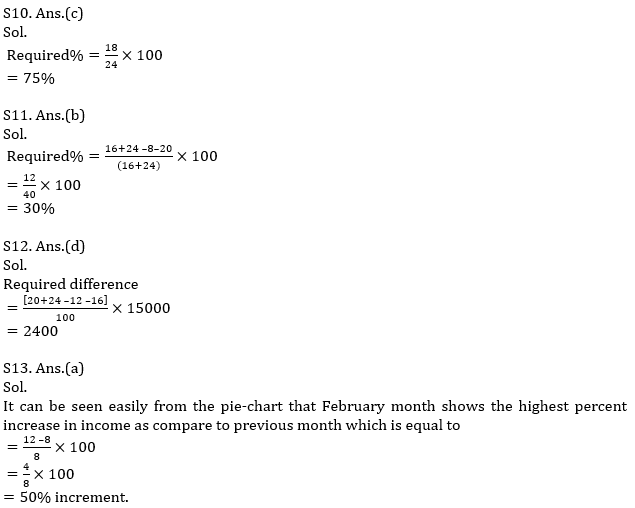
Directions (11-15): Pie-chart given below shows total income of Sandeep in six different months and percentage distribution in these months. Study the data carefully and answer the following questions.
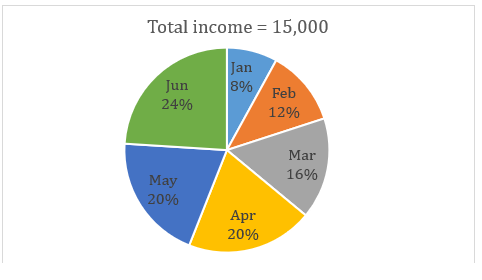
Q11. Income of Sandeep in the month of Jan and April together is what percent less than income of Sandeep in the month of Mar and Jun together?
(a) 20%
(b) 30%
(c) 40%
(d) 50%
(e) 70%
Q12. Income of Sandeep in May and Jun together is how much more than the income of Sandeep in Feb and March together?
(a) 1500
(b) 1800
(c) 1200
(d) 2400
(e) 2700
Q13. Which month shows the highest percent increment in income as compare to previous month?
(a) Feb
(b) March
(c) April
(d) May
(e) Both (b) and (c)
Q14. Income in the month of March and April together makes how much central angle of the total?
(a) 115.2°
(b) 158.4°
(c) 144°
(d) 100.8°
(e) 129.6°
Q15. Sandeep’s average income in starting four month in the given six months is how much less than Sandeep’s average income in last four months in the given six months?
(a) 300
(b) 600
(c) 900
(d) 1200
(e) 1500
Practice More Questions of Quantitative Aptitude for Competitive Exams:
Solutions
Click Here to Register for Bank Exams 2020 Preparation Material


 RBI Assistant Score Card 2026, Download ...
 IBPS Calendar 2026-27 Out @ibps.in for P...
 HPSCB Junior Clerk Exam Date 2026, Check...


