

Directions (1-5): Study the following data carefully to answer the questions that follow:
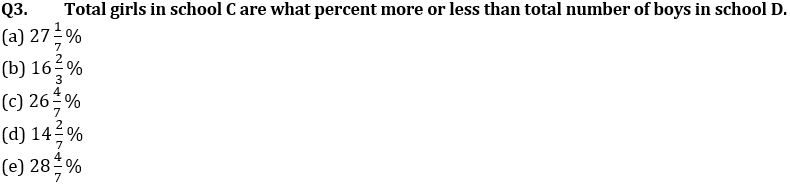
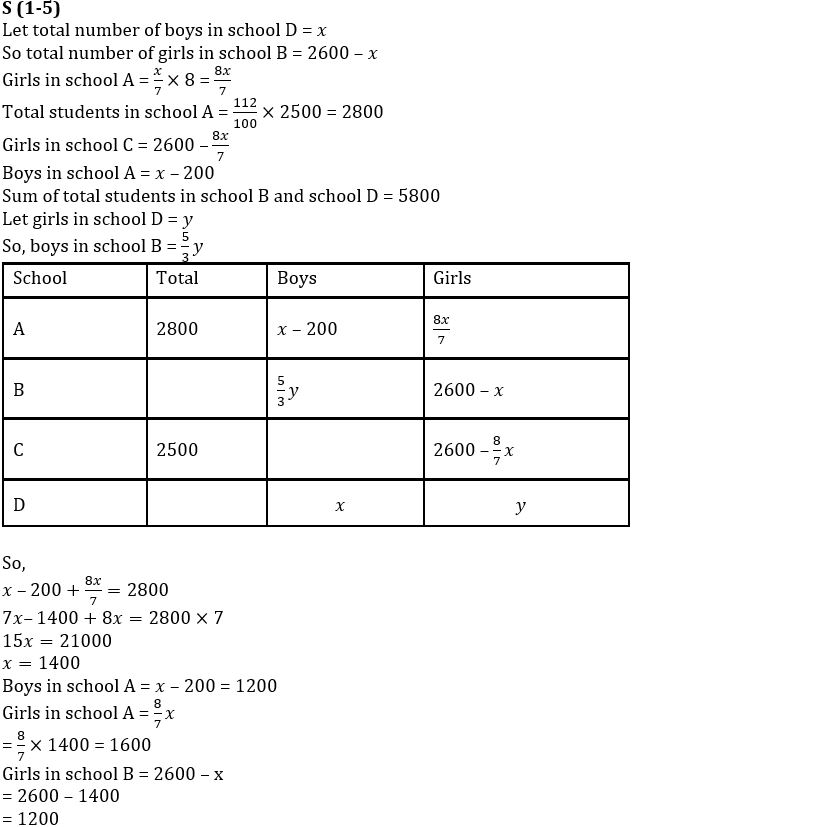
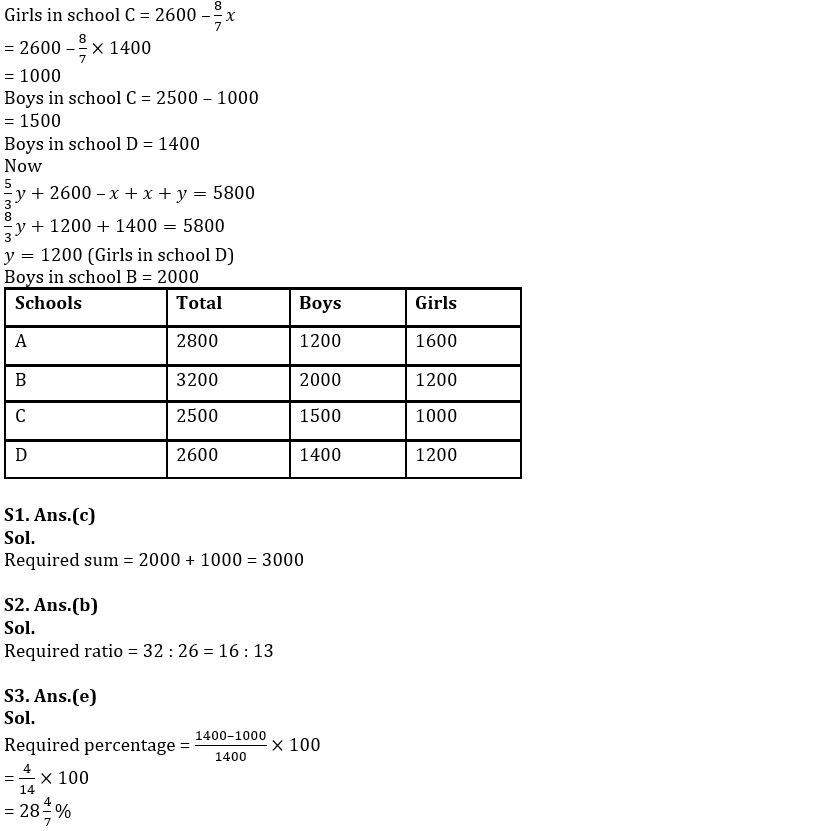
There are four schools A, B, C and D. Sum of girls in school B and boys in school D is 2600. Ratio of boys in school D to girls in school A is 7 : 8. Total students in school C is 2500 and total students in school A 12% more than total student in school C. Sum of girls in school A and C is 2600.
Difference between boys in school A and boys in school D is 200 where number of boys in school D are more than number of boys in school A. sum of total students in school B and school D is 5800. Boys in school B are 66⅔% more than girls in school D.
Q1. What is the sum of boys from school B and girls from school C.
(a) 2850
(b) 3100
(c) 3000
(d) 2800
(e) 2600
Q2. What is the ratio of total student in school B to the total students in school D.
(a) 21 : 8
(b) 16 : 13
(c) 15 : 14
(d) 17 : 12
(e) 19 : 10
Q4. What is the difference between the average of total girls from all school and average of total boys from all the schools.
(a) 275
(b) 250
(c) 260
(d) 280
(e) 285
Q5. If a girl is chosen at random from all the schools then find the probability that chosen girl is from school C.
(a) 1/11
(b) 2/9
(c) 7/18
(d) 1/5
(e) 1/7
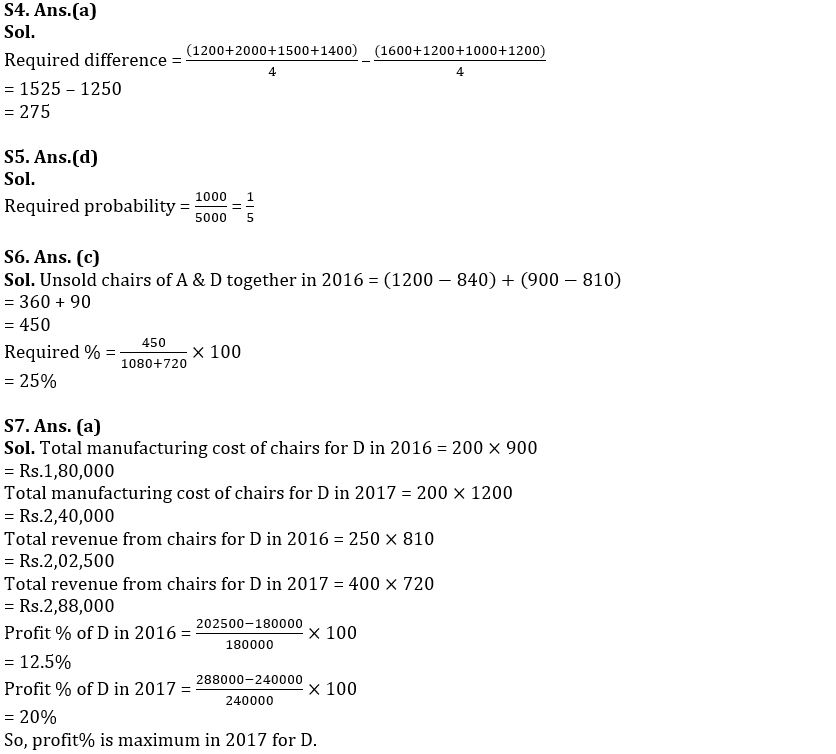
Directions (6-10): Study the line chart and table given below and answer the following questions.
Line chart shows the number of chairs manufactured by 4 different chair manufacturers (A, B, C & D) in 2016 & 2017 and table shows the number of chairs sold by these manufacturers in 2016 & 2017.
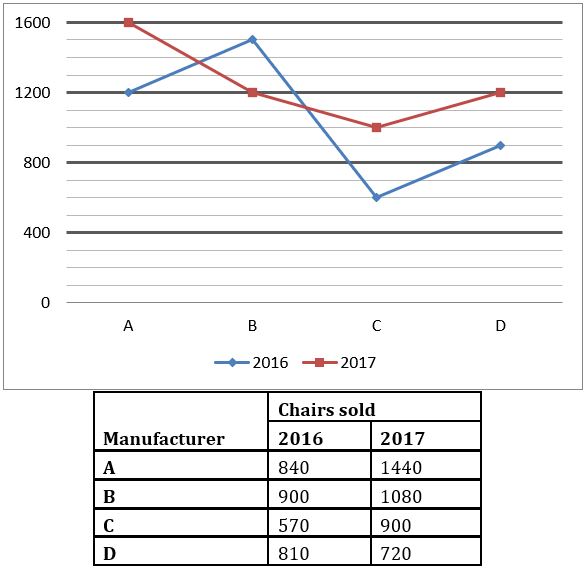
Note – Total chairs manufactured by any manufacturer in any year = Total chairs (sold + unsold) of that manufacturer in that year.
Q6. Unsold chairs of A & D together in 2016 are what percent of sold chairs of B & D together in 2017?
(a) 75%
(b) 40%
(c) 25%
(d) 55%
(e) 60%
Q7. If manufacturing cost of a chair for D in 2016 & 2017 is Rs.200 and selling price of a chair for D in 2016 & 2017 is Rs.250 and Rs.400 respectively, then find profit% is maximum in which year among 2016 & 2017 for D? (D destroyed all the unsold chairs in these 2 years)
(a) Maximum in 2017
(b) Maximum in 2016
(c) Equal in 2016 & 2017
(d) None of these
(e) Cannot be determined
Q8. Find ratio of chairs manufactured by A & C together in 2016 to chairs sold by C & D together in 2017.
(a) 7 : 5
(b) 11 : 5
(c) 12 : 7
(d) 10 : 9
(e) 5 : 3
Q9. If chairs manufactured by A in 2018 are 50% more than chairs sold by B in 2016 and ratio of sold to unsold chairs of A in 2018 is 2 : 1, then find average of chairs sold by A in 2016, 2017 & 2018.
(a) 1150
(b) 1060
(c) 1200
(d) 1170
(e) 1030
Q10. Find average number of chairs sold by A, B, C & D in 2016 is how much more or less than total unsold chairs of A, B, C & D together in 2017?
(a) 80
(b) 160
(c) 350
(d) 190
(e) 270
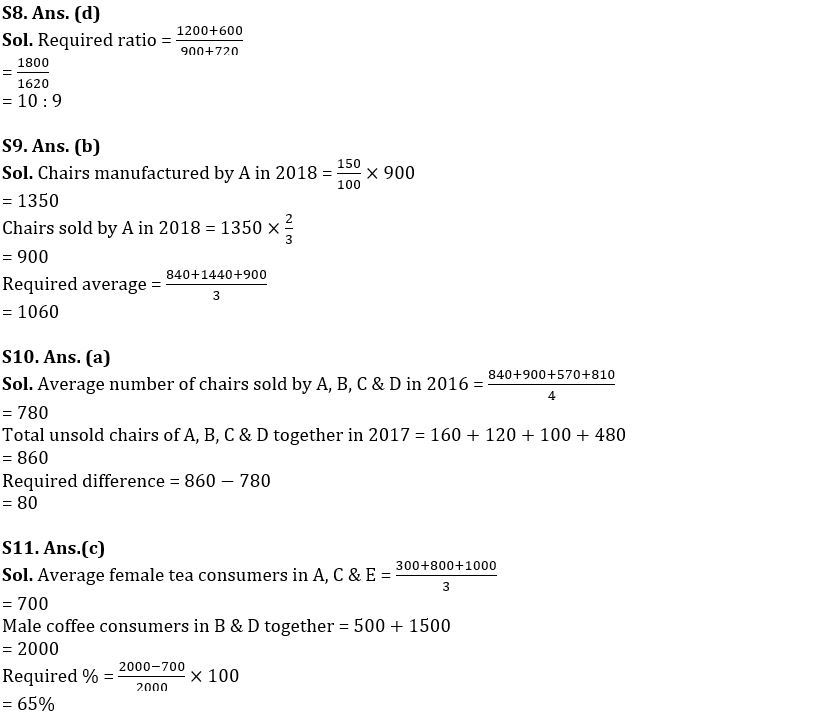
Directions (11-15): Study the table given below and answer the following questions.
Table shows the number of tea and coffee consumers in 5 different companies (A, B, C, D & E).
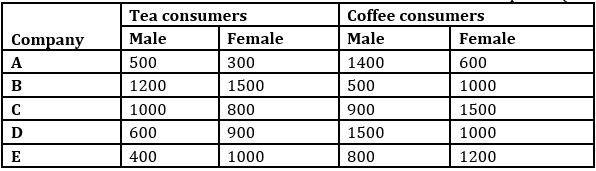
Q11. Average female tea consumers in A, C & E together are what percent less than male coffee consumers in B & D together?
(a) 50%
(b) 15%
(c) 65%
(d) 30%
(e) 45%
Q12. If ratio of male to female black tea consumers and green tea consumers in D is 8 : 7 and 1 : 4 respectively and black tea consumers in D are 50% more than green tea consumers in D, then find black tea consuming females and green tea consuming males together in D are how much more or less than tea consuming females in A & C together? (In D, only two types of tea is available – black and green)
(a) 560
(b) 420
(c) 450
(d) 500
(e) 540
Q13. Male tea consumers in C, D & E together are what percent of female coffee consumers in A & B together?
(a) 150%
(b) 75%
(c) 100%
(d) 175%
(e) 125%
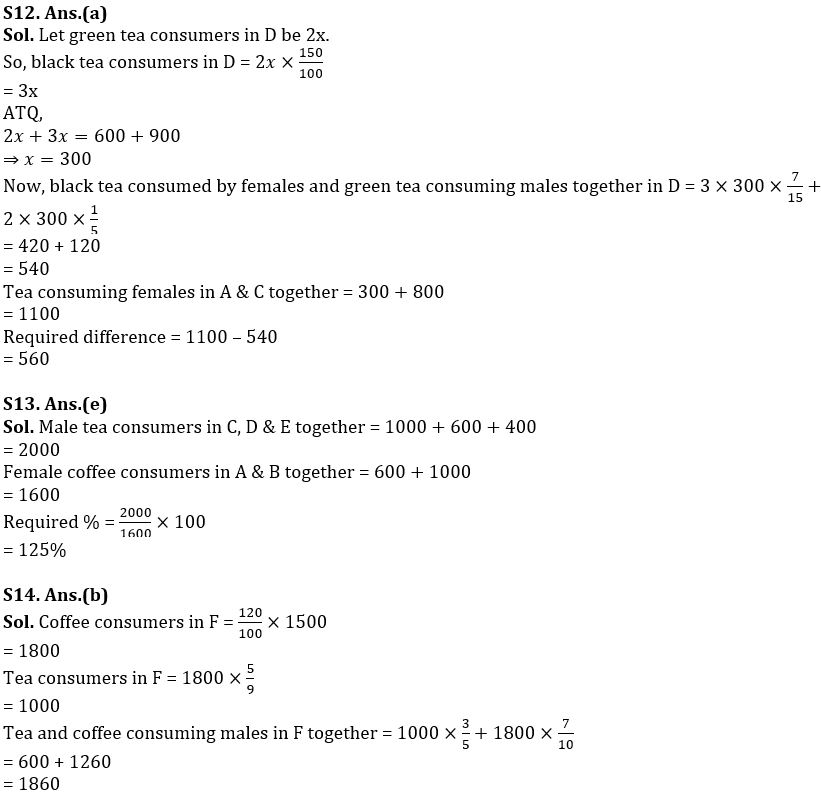
Q14. If ratio of male to female tea and coffee consumers in F is 3 : 2 and 7 : 3 respectively and coffee consumers in F are 20% more than coffee consuming males in D, then find tea and coffee consuming males in F together. (ratio of tea consumers to coffee consumers in F is 5 : 9)
(a) 1250
(b) 1860
(c) 1480
(d) 1680
(e) None of the above.
Q15. Find ratio of coffee consuming females in C & E together to tea consuming males in B & D together.
(a) 7 : 2
(b) 3 : 1
(c) 5 : 4
(d) 3 : 2
(e) 5 : 3
Solutions


 Quantitative Aptitude Quiz For Bank Main...
 Quantitative Aptitude Quiz For Bank Foun...


