
DI for Banking Exams like SBI PO & IBPS PO- Get an edge over other students by knowing all types of DI that is being asked in the Prelims and Mains Examinations.
![]()
DI Questions Asked in SBI and IBPS Exams 2019
| Exam Name | Number of Questions | Percentage of DI Questions in Section | Details |
| SBI PO Pre 2019 | 15 /35 | 43% | Caselet, table, line |
| IBPS PO Pre 2019 | 15 /35 | 43% | Caselet, table, line |
| RRB PO Pre 2019 | 12/40 | 30% | Table, bar |
| SBI PO Mains | 25/35 | 71% | Caselt, line, funnel , table |
| IBPS PO Mains | 34/35 | 97% | Caselet based on time and work, missing DI, Aritmatic based on probability etc |
In this article we will be covering the Different Types of Data Interpretation like Tabular DI, Bar Graph, Pie Chart, Mixed DI & Others.
Different Types of Data Interpretation You Need to Prepare for SBI & IBPS Exams 2020 | Part-2
Data Interpretation for SBI PO & IBPS PO Prelims 2020– It is expected that The State Bank Of India will release its notification for Probationary Officer 2020 Recruitment once the situation will be under control. As per the past trend, SBI uses to release the notification in the first week of April or last week of march but this year, due to coronavirus everything has come to a halt. That is why as a precautionary measure, SBI has not yet released the notification. Students are although advice to work harder and make the maximum advantage of this lockdown. Now is the perfect time to start your preparation.
- Join the 1st Ever One to One Data Interpretation Batch by Adda247
- Register to Get Free Counselling for the One to One DI Batch
As we all know that Data Interpretation forms an important part of prelims and mains exam. So, here we are providing you with different types of DI that you must practice before appearing for SBI 2020.
In DI students are expected to comprehend data given and find out the answers.
TABULAR DI
Tabular DI is one of the basic forms of representing data. Tabular DI is also of two types where all the data is given and the other one is where some data is missing and student is suppose to find out those missing values. You can practice tabular data interpretation from the link given below.
Table DI
| Stores | Total ball point pens sold | Ratio of ball point pens to gel pens sold |
| A | 108 | 9 : 5 |
| B | 240 | 6 : 5 |
| C | 200 | 4 : 1 |
| D | 150 | 3 : 1 |
| E | 120 | 3 : 2 |
Missing Table DI
| Person
Days |
A | B | C | D | E |
| Monday | 420 | 440 | 240 | — | 280 |
| Tuesday | 360 | — | 520 | 210 | 410 |
| Wednesday | 280 | 240 | 410 | 425 | — |
| Thursday | 540 | 510 | — | 630 | 160 |
| Friday | — | 460 | 350 | 510 | 400 |
BAR GRAPH
This is another way to represent data. In this different size of bars are use to represent the data. Each bar or any other pattern on the bar represent a different data of the given quantity. You can practice Bar Graph data interpretation from the link given below.
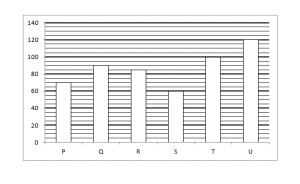
Sample Questions
- Pass percentage of school S is equal to that of school Q. Find total strength of school Q is what % more than that of school
- If fail percentage of school P is 65% then, find number of student failed from school P is what percentage of number of student passed from school T.
- If ratio between total student who passed to who failed from all school is 7 : 3, then find the total number of failed student from all schools together.
- Student passed from school P, Q, U and T together is how much more than that of school R and S together.
- Failed student of school U is 15 more than that of school R. If ratio between total strength of school U to school R is 3 : 2, then find the total number of failed student from both schools together.
LINE GRAPH
Line graph is another form of data representation. In Line graph data two points will be joined together thus forming a slope which will either indicate growth or decline. A keen focus is needed while solving this type of Data Interpretation as the chances of getting confused is high because of the similarity in lines drawn. You can practice Line Graph data interpretation from the link given below.
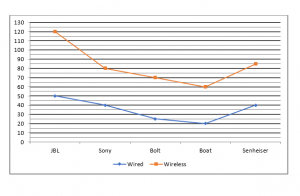
Sample Questions
- What is average of wired headphones sold of all brands?
- Headphones (wired & wireless both) sold of JBL are what percent more/less than that of Sony?
- What is ratio of wired headphones sold of Boat & Bolt together to wireless headphones sold of Sony & Senheiser together?
- What is difference of average of wireless headphones sold of Boat & Sony together and wired headphones sold of JBL?
- Total headphones sold by Boat are how much less than average of wireless headphones sold of all brand?
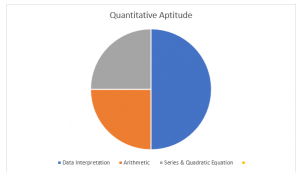
PIE CHARTS
Pie chart data interpretation can be seem easy for those who are good at percentage and degree. This type of data interpretation mainly requires calculation of data and calculation may require conversion of percentage into or degree or vice versa. Hence, Students are advised to read the question carefully before answering the question. You can practice Pie chart data interpretation from the link given below.
Given pie diagram shows the percentage distribution of number of registered voters in 5 villages.
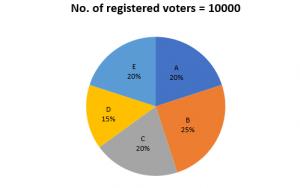
Sample Questions
- If 20% of registered voters in village B did not cast their vote and 10 % of votes cast were found invalid. Find no. of valid votes cast in village B.
- In village C, 10% of registered voters did not cast their vote and no vote was invalid from the votes which were cast. The winning candidate defeated the other candidate by 12% of votes cast. Find no. of votes obtained by losing candidate. (There are only 2 candidates contesting in elections in village C)
Different Types of Data Interpretation You Need to Prepare for SBI & IBPS Exams 2020 | Part-2
Join the 1st Ever One to One Data Interpretation Batch by Adda247
Register to Get Free Counselling for the One to One DI Batch
Share your doubts on blogger@adda247.com
| Upcoming Bank Exams 2020 | Government Jobs for Graduates 2020 | Consumer Price Index: Definition, Types, Measurement |


 Kurmanchal Bank Clerk Exam Date 2026 Out
 LIC HFL Exam Date 2026 Out, Check Offici...
 LIC HFL Admit Card 2026 Out @www.lichous...


