
Data Interpretation is the most important topic that you have to prepare to crack IBPS or SBI or any other bank exam. In part-1 of the article Different Types of Data Interpretation You Need to Prepare for SBI & IBPS Exams 2020 we discussed about the conventional types of DIs mostly seen in exams like – tabular, pie chart, bar graph, line charts and here in part-2 we will be discussing about some miscellaneous or new types of DIs that usually increase the level of the exam.
![]()
Different Types of Data Interpretation You Need to Prepare for SBI & IBPS Exams 2020| Part-1
COMBINATION GRAPH OR MIXED GRAPH DATA INTERPRETATION
These type of data interpretation are usually seen in Mains exam of banking exams as they increases the difficulty level of the question but at many time such type of data are seen in prelims as well. In this type of data interpretation, two different types of graph are mix and their information is inter related. You can practice combination graph data from the link given below:
- Join the 1st Ever One to One Data Interpretation Batch by Adda247
- Register to Get Free Counselling for the One to One DI Batch
MISCELLENOUS DATA INTERPRETATION
These are usually the data representation in graphs which we are not commonly aware of or we dont see in our daily life. Though these questions seems difficult but can be scoring as they are considered to be doable and their difficulty level is not much high in comparison to mixed graph DI. Miscellenous data are of different types as given below.
- Radar DI
- Caselet DI
- Arithmetic DI
You can practice miscellenous data interpretation from the link given below:
Given below is the pie chart which shows the number of persons visiting a national park on different days and table shows the ratio of male to female visiting these parks.
Mixed DI
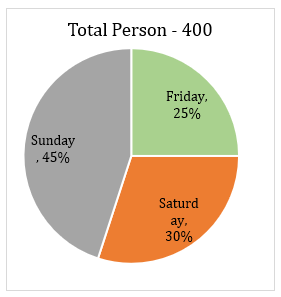
| Days | Male : Female |
| Friday | 2 : 3 |
| Saturday | 5 : 7 |
| Sunday | 5 : 4 |
Sample Questions
- If on Monday number of males who visited national park are increased by 20% over males visiting national park on Saturday and Females visiting national park on Monday is more than females visiting on Friday then, find the total persons visiting national park on Monday.
- Total females visiting national park on Sunday and Saturday together are what percent more or less than total male visiting national park on Friday and Sunday together.
- Join the 1st Ever One to One Data Interpretation Batch by Adda247
- Register to Get Free Counselling for the One to One DI Batch
Aritmetic DI
The line graph represents the speed of 4 different boats in still water(in km/hour) and the speed of stream is 8 km/hour for every boat.
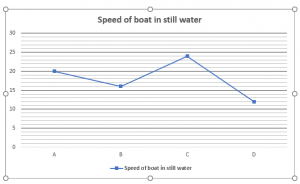
Sample Questions
- What is the total time taken by boat A to cover 168 km downstream and 48 km upstream?
- Speed of boat B in downstream is what % of total speed of boat C and D together in upstream?
Caselet DI
Directions (1 – 5): Read the following passage carefully & answer the questions.
A, B, C entered into a partnership by investing in ratio 2 : 3 : 4. After 6 months, B invested an additional amount in order to make its present capital equal to initial investment of C. after 2 more months A invested an additional amount such that its present investment is equal to average of initial investment of B & C. after another 2 months, C withdrew an amount to make its investment equal to initial investment of B. at the end of the year, the profit of B is Rs 4200 out of total profit of Rs 11800.
Sample Questions
- Find difference between profits of A & C after the end of year.
- If each again invested for another year with the same amount which was left with them at the end of first year, find their profit ratio (A, B, C) at the end of 2 year of partnership.
Radar DI
Radar chart shows the number of students (in ’00) in 5 different schools (A, B, C, D & E) in 2017 & 2018.
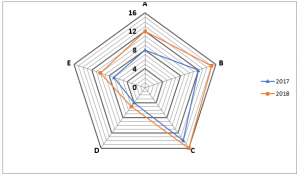
Sample Questions
- Students in A in 2017 & 2018 together are what percent more or less than students in B & E together in 2018?
- If ratio of boys to girls in C in 2017 and 2018 is 3 : 2 and 5 : 3 respectively, then find ratio of number of boys in C in 2017 and 2018 together to total students in B in 2017.
Join the 1st Ever One to One Data Interpretation Batch by Adda247
Register to Get Free Counselling for the One to One DI Batch
Share your doubts on blogger@adda247.com
| Upcoming Bank Exams 2020 | Government Jobs for Graduates 2020 | IBPS Clerk Syllabus 2020 for Prelims and Mains Exam |


 How to Analyze Mock Test Mistakes for RB...
 SBI Apprentice Selection Process 2026, C...
 Simple Interest Questions for Bank Exams

