

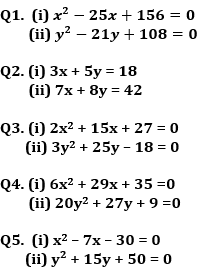
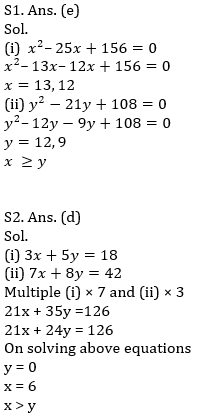
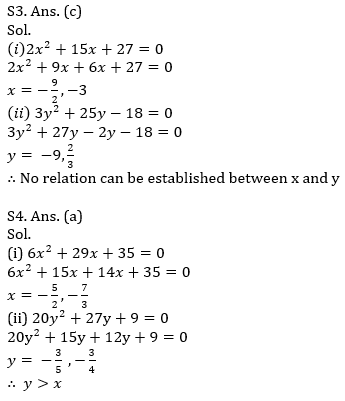
Directions (1-5): Solve the given quadratic equations and mark the correct option based on your answer—
(a) x < y
(b) x ≤ y
(c) x = y or no relation can be established between x and y.
(d) x > y
(e) x ≥ y
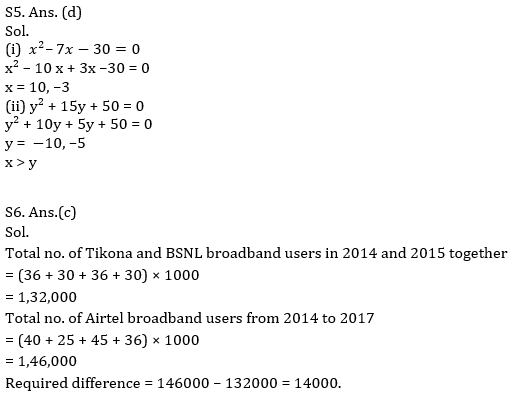
Directions (6-10): The following line graph shows the number of broadband users (in thousands) of three different suppliers in five different years. Read the data carefully and answer the following questions.
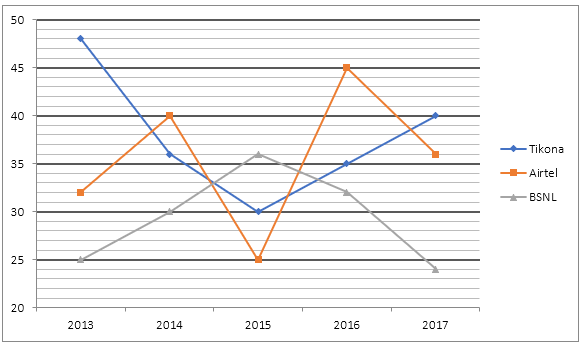
Q6. The total number of Tikona and BSNL broadband users in 2014 and 2015 together is how much more or less than the total number of Airtel broadband users from 2014 to 2017.
(a) 12,800
(b) 13,000
(c) 14,000
(d) 14,800
(e) 15,000
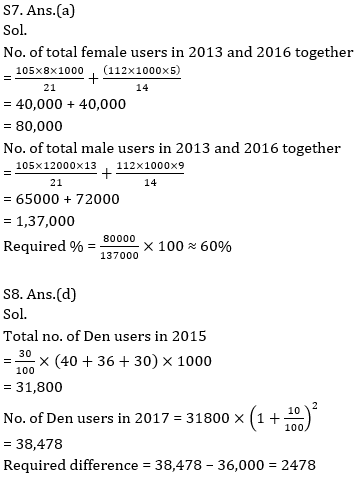
Q7. Out of total broadband users in 2013, ratio of male to female users is 13 : 8 while in 2016, the ratio of male to female is 9 : 5. Then, find the total number of female users in these two years is approximately what percent of the total number of male users in these two years ?
(a) 60%
(b) 50%
(c) 70%
(d) 40%
(e) 80%
Q8. Number of Den broadband users in 2015 is 30% of the total users of these three broadband in 2014. And, the number of users of Den increases by 10% every year then total number of Den users in 2017 is how much more/less than total number of Airtel users in 2017.
(a) 2168
(b) 2388
(c) 2428
(d) 2478
(e) 2558
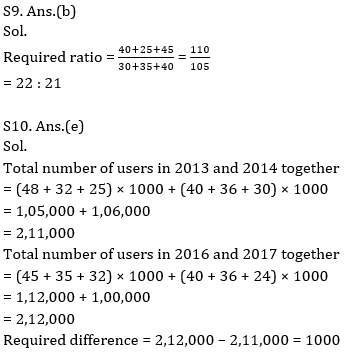
Q9. Find the ratio of total number of Airtel users from 2014 to 2016 to the total number of Tikona users from 2015 to 2017 ?
(a) 10 : 9
(b) 22 : 21
(c) 11 : 10
(d) 42 : 41
(e) 4 : 3
Q10. Find the difference of the total number of users in 2013 and 2014 together and the total number of users in 2016 and 2017 together?
(a) 800
(b) 1200
(c) 1500
(d) 900
(e) 1000
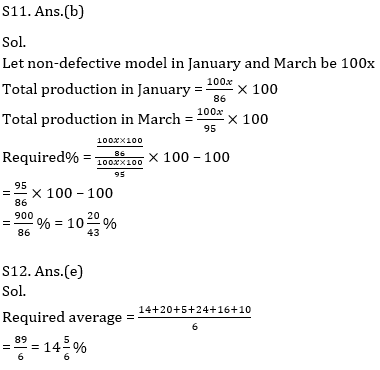
Directions (11-15): Given bar graph shows the percentage of defective model of article A out of total model manufacture in six months. Read the data carefully and answer the question.
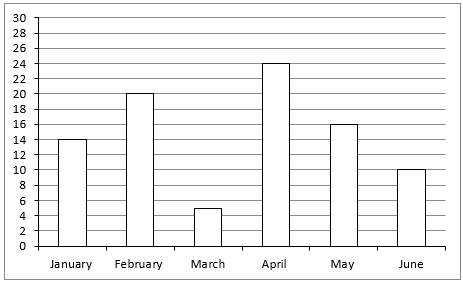
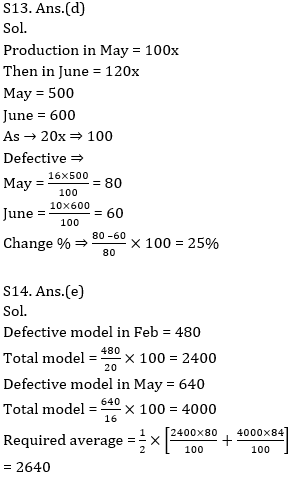
Q13. Production of model in June is increased by 100 (20%) from the previous month. Then find the percentage change in the number of defective models in June over month of May.
(a) 20%
(b) 33 ⅓%
(c) 16%
(d) 25%
(e) 21%
Q14. Number of defective models in February and May are 480 and 640 respectively, then find the average of Non-defective model in same months.
(a) 2740
(b) 2410
(c) 2520
(d) 2420
(e) 2640
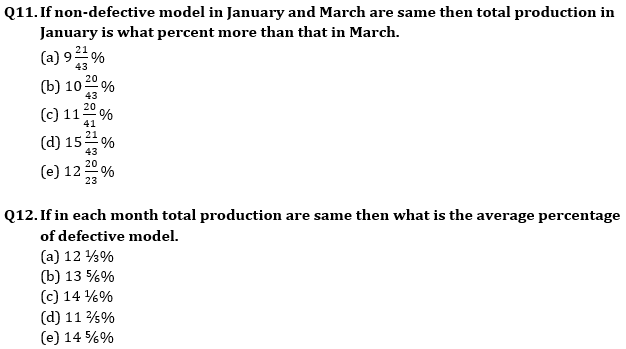
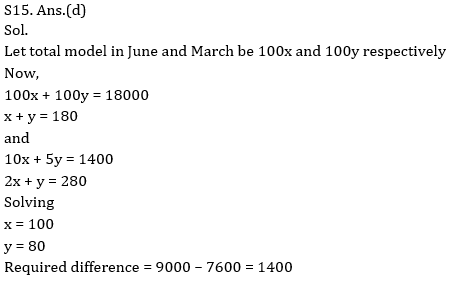
Q15. None defective model in June is how much more than that of in March if total model in June and March is 18000 and total defective model is 1400.
(a) 1200
(b) 1000
(c) 9000
(d) 1400
(e) 4500
Practice More Questions of Quantitative Aptitude for Competitive Exams:
Quantitative Aptitude for Competitive Exams |
Quantitative Aptitude Quiz For ECGC PO 2021- 18th February |
Quantitative Aptitude Quiz For ECGC PO 2021- 17th February |
ECGC PO Study Plan 2021 |
Solutions
![]()
Practice with Crash Course and Online Test Series for ECGC PO 2021:
- ECGC Online Coaching Classes for Probationary Officier 2021
- ECGC PO Mock Tests 2021 – Banking Online Test Series (With Solutions) by Adda247
- ECGC PO 2021 Complete eBooks Kit (English Medium)
Click Here to Register for Bank Exams 2020 Preparation Material


 HPSCB Junior Clerk Exam Date 2026, Check...
 DSSSB IT Assistant Vacancy 2026 Notifica...
 SBI SCO Recruitment 2026, Last Date to A...


