
![]()
Directions (1-5) : Given below line graph shows Import (in hundred cr.) and export (in hundred cr.) of India to US of a duration of 2011 -2015. Read the data carefully and answer the questions.
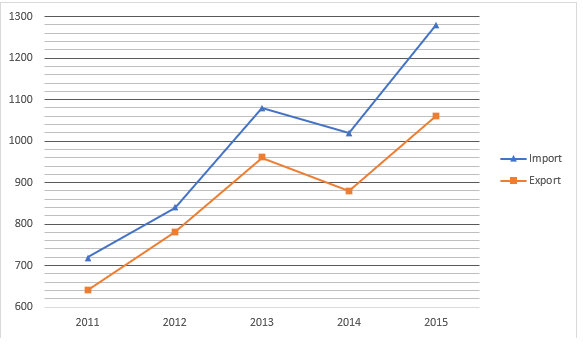
Trade deficit = Import – Export
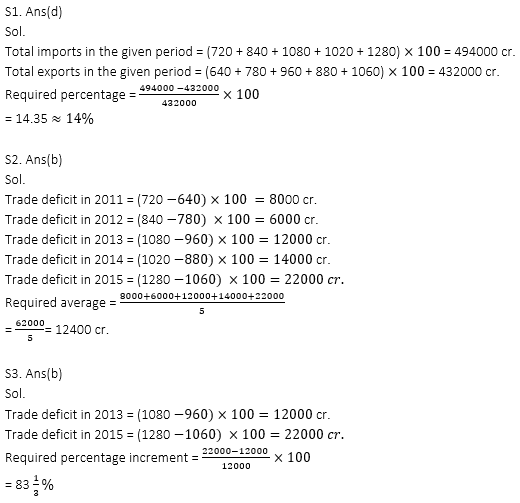
Q1. The total imports are approximate what percent more than total exports in the given period?
(a) 28%
(b) 8%
(c) 20%
(d) 14%
(e) 24%
Q2. Find the average of trade deficit in the given period?
(a) 12000 cr.
(b) 12400 cr.
(c) 12800 cr.
(d) 14400 cr.
(e) 13600 cr.
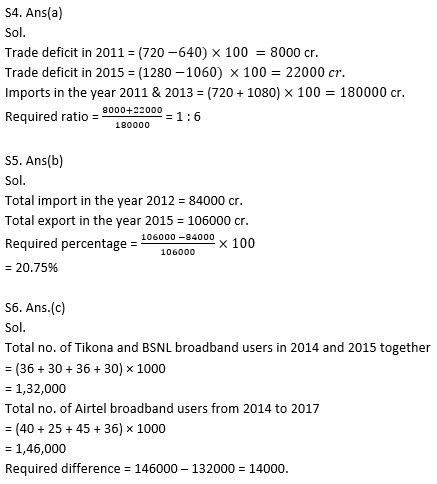
Q4. Find the ratio of trade deficit in the year 2011 & 2015 together to Imports in the year 2011 & 2013 together?
(a) 1 : 6
(b) 1 : 5
(c) 3 : 5
(d) 1 : 4
(e) 1 : 7
Q5. Total import in the year 2012 is what percent less than total export in the year 2015?
(a) 16.75%
(b) 20.75%
(c) 24.75%
(d) 28.75%
(e) 32.75%
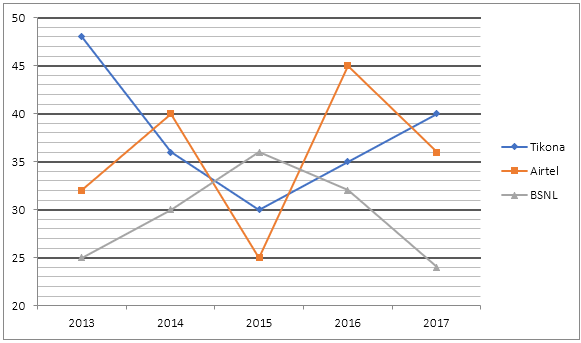
Directions (6-10): The following line graph shows the number of broadband users (in thousands) of three different suppliers in five different years. Read the data carefully and answer the following questions.
Q6. The total number of Tikona and BSNL broadband users in 2014 and 2015 together is how much more or less than the total number of Airtel broadband users from 2014 to 2017.
(a) 12,800
(b) 13,000
(c) 14,000
(d) 14,800
(e) 15,000
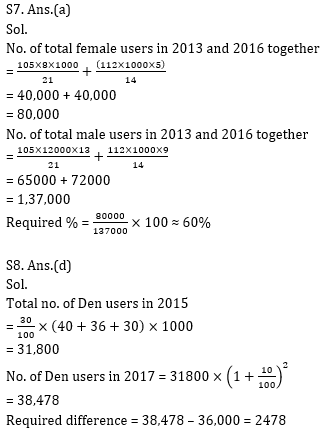
Q7. Out of total broadband users in 2013, ratio of male to female users is 13 : 8 while in 2016, the ratio of male to female is 9 : 5. Then, find the total number of female users in these two years is approximately what percent of the total number of male users in these two years ?
(a) 60%
(b) 50%
(c) 70%
(d) 40%
(e) 80%
Q8. Number of Den broadband users in 2015 is 30% of the total users of these three broadband in 2014. And, the number of users of Den increases by 10% every year then total number of Den users in 2017 is how much more/less than total number of Airtel users in 2017.
(a) 2168
(b) 2388
(c) 2428
(d) 2478
(e) 2558
Q9. Find the ratio of total number of Airtel users from 2014 to 2016 to the total number of Tikona users from 2015 to 2017 ?
(a) 10 : 9
(b) 22 : 21
(c) 11 : 10
(d) 42 : 41
(e) 4 : 3
Q10. Find the difference of the total number of users in 2013 and 2014 together and the total number of users in 2016 and 2017 together?
(a) 800
(b) 1200
(c) 1500
(d) 900
(e) 1000
Directions (11 – 15): Given below line graph shows number of food packets (in hundred) distibributed by Kerala government in 5 cities which are flood affected and graph also shows percentage of packets counsumed by people in these five cities. Read the data carefully and answer the questions.
Note- Total packet in any city= Consumed packets + Unconsumed packets
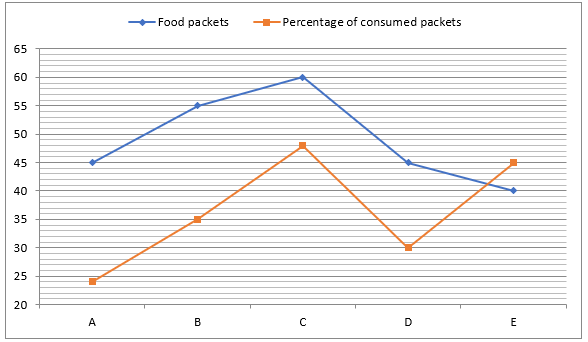
Q11. If total number of packets distributed in city X is 33⅓% more than that of total unconsumed packets in the city C and total 35% people consumed packets in city X, then find difference between total unconsumed packets in city X and A?
(a) 300
(b) 320
(c) 360
(d) 716
(e) 240
Q12. Find the ratio of difference between consumed food packets in city A & E to the difference between consumed food packets in the city B & D?
(a) 144 : 115
(b) 144 : 125
(c) 144 : 119
(d) 144 : 109
(e) 144 : 135
Q13. 55% of total consumed food packets in city C are consumed by male, then find total food packets consumed by female in same city is approximately what percent of total unconsumed food packets in city A?
(a) 42%
(b) 44%
(c) 46%
(d) 38%
(e) 48%
Q14. Find the sum of number of unconsumed food packets in city A, B, C & E?
(a) 13045
(b) 12315
(c) 13040
(d) 12055
(e) 13025
Q15. If total food packets distributed by Kerala government in all cities including these five cities is 925% more than total food packet consumed in city C, then find total food packets distributed in other cities except these five cities?
(a) 5040
(b) 5060
(c) 5020
(d) 5080
(e) 5000
Practice More Questions of Quantitative Aptitude for Competitive Exams:
| Quantitative Aptitude for Competitive Exams |
Quantitative Aptitude Quiz for Prelims Exams- SBI & IBPS 2020- 2nd December |
Quantitative Aptitude Quiz For Prelims Exams- SBI & IBPS 2020- 1st December |
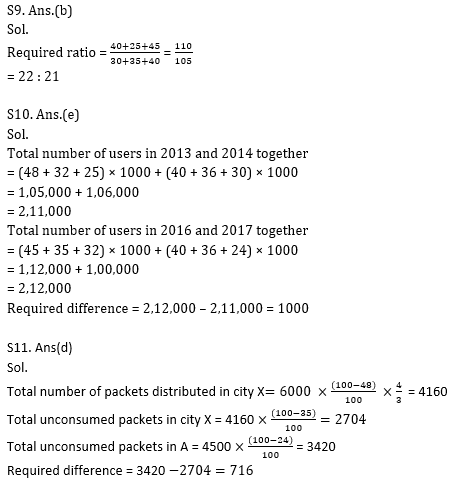
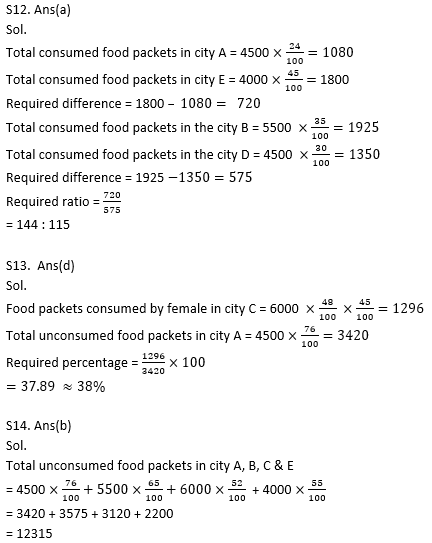
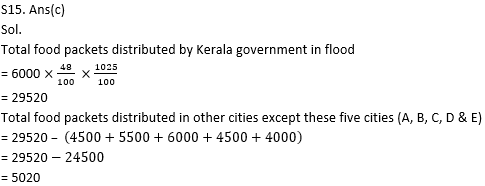
Solutions
Practice with Crash Course and Online Test Series for IBPS Clerk Prelims:
- Bank Test Pack Online Test Series (12 Months)
- IBPS PO and Clerk Prime 2020-21 Online Test Series
- SBI PO Prime 2020-21 Online Test Series
Click Here to Register for Bank Exams 2020 Preparation Material


 World Bicycle Day 2026, Theme, History &...
 Daily Current Affairs Quiz 2nd June 2026...
 Daily Current Affairs and GK Updates (1s...


