

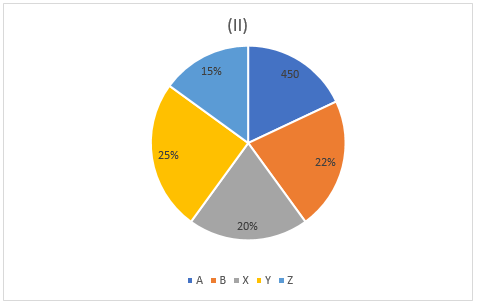
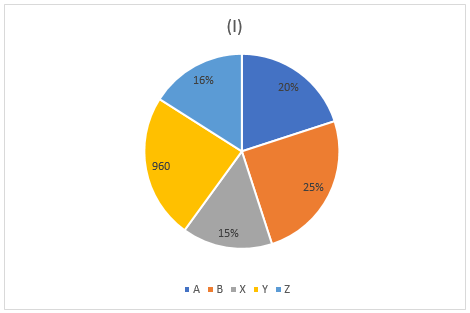
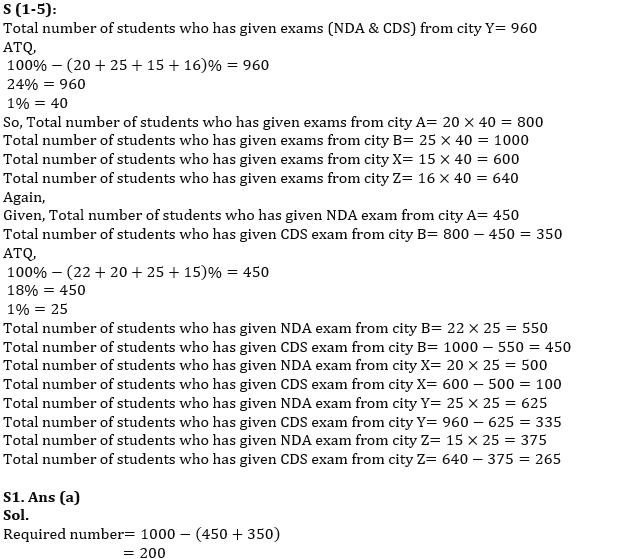
Directions (1–5): Pie graph (I) shows percentage distribution of students who had given two different defence exams (NDA & CDS) from five cities and Pie graph (II) shows percentage distribution of people who had given only NDA from these five cities. Read the data carefully and answer the questions given below.
Note: One student has given only one exam, either NDA or CDS.
Q1. Find the number of students who had given CDS exam from city B and A together are how much more or less than the total number of students who has given exams from city B?
(a)200
(b)150
(c)100
(d)250
(e)300
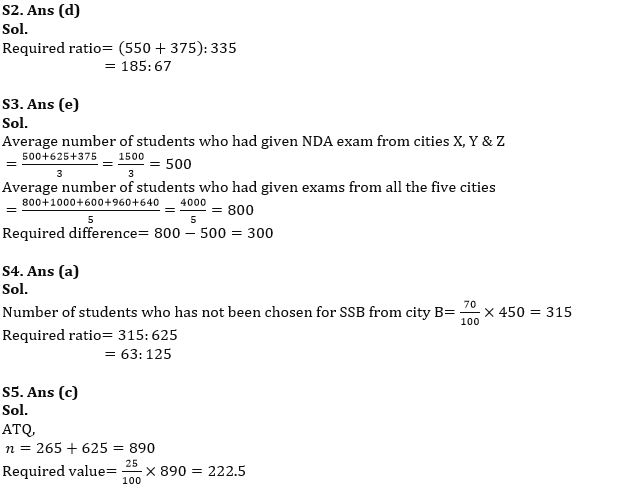
Q2. Find the respective ratio of number of students who had given NDA exam from city B & Z together to the number of students who had given CDS exam from city Y?
(a)136: 77
(b)157: 69
(c)181: 91
(d)185: 67
(e)155: 79
Q3. Find the difference between the average number of students who had given NDA exam from cities X, Y & Z and the average number of students who had given exams from all the five cities?
(a)250
(b)350
(c)100
(d)200
(e)300
Q4. If only 30% students, who has given CDS exam from city B, has been selected for SSB then find the respective ratio of number of students who has not been chosen for SSB from city B to the number of students who had given NDA exam from city Y?
(a)63: 125
(b)72: 131
(c)125: 72
(d)131:72
(e)125: 131
Q5. If ‘n’ be the sum of number of students who has given CDS exam from city Z and number of students who has given NDA exam from city Y, then find the 25% of n?
(a)236.25
(b)196.25
(c)222.50
(d)212.50
(e)186.50
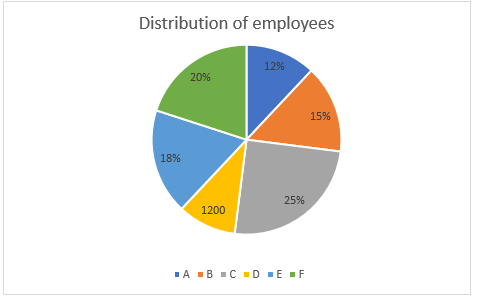
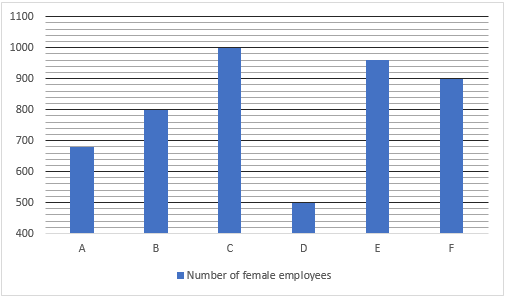
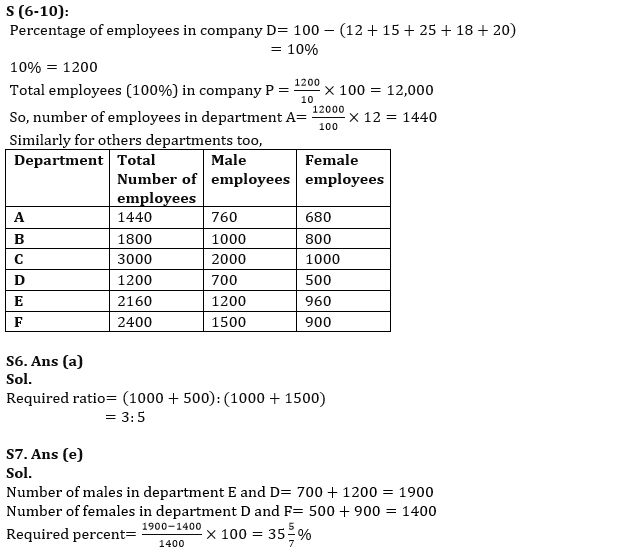
Directions (6-10): Read the following pie chart and bar graph carefully and answer the questions given below.
Given below the pie chart shows percentage wise distribution of employees in six different department, A, B, C, D, E & F of a company P. While the bar graph shows numbers of females in each department of company.
Q6. Find the ratio of total number of females in department C and D together to total number of males in department B and F together?
(a)3:5
(b)5:4
(c)4:3
(d)3:7
(e)4:7
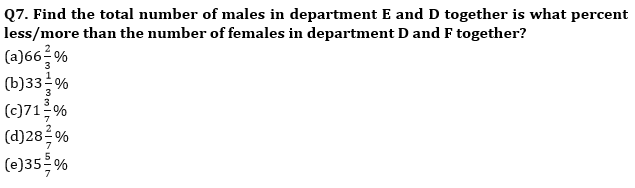
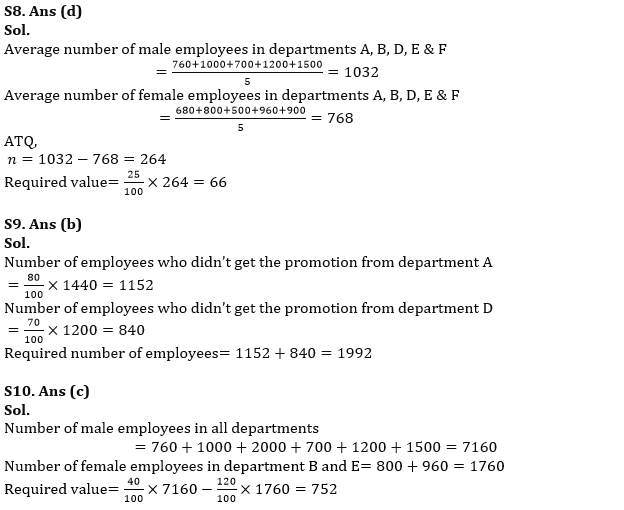
Q8. If ‘n’ be the difference between the average number of males and that of females in all department excluding department C, then find the value of 25% of n?
(a)84
(b)78
(c)60
(d)66
(e)72
Q9. 20% of employees from department A and 30% employees from department D were selected for promotion, then find the total number of employees who didn’t get the promotion from department A and D together?
(a)2020
(b)1992
(c)1866
(d)2114
(e)None of these
Q10. Find the difference between 40% of total number of male employees in all departments and 120% of female employees in department B and E together?
(a)696
(b)846
(c)752
(d)702
(e)816
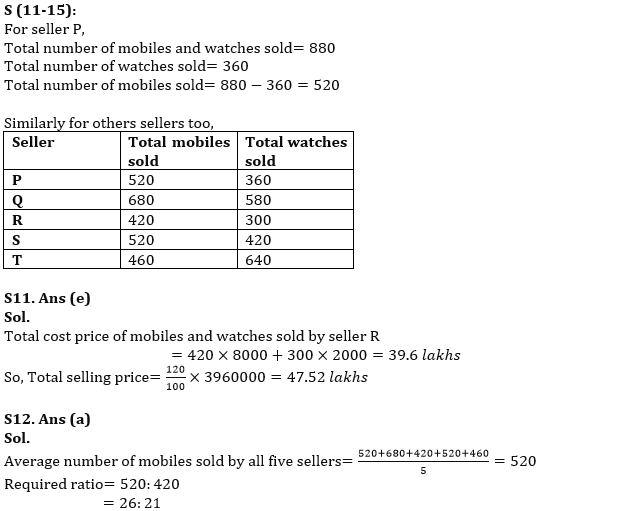
Directions (11-15): Read the following bar graph carefully and answer the questions given below.
Given the bar graph shows the total number of electric gadgets (mobile and watch) sold by five different seller, P, Q, R, S & T, and number of watches sold by each seller.
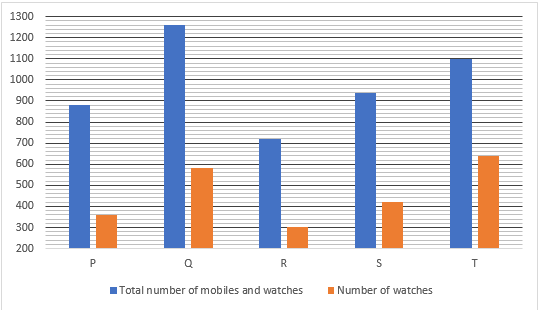
Q11. If the cost price of each mobile and watch sold by seller R is Rs. 8000 and Rs. 2000 respectively and the total profit earned by seller is 20%, then find the total selling price of mobiles and watches together? (in lakhs)
(a)32.58
(b)36.80
(c)42.76
(d)39.60
(e)47.52
Q12. Find the ratio of average number of mobiles sold by all five sellers together to total number of watches sold by seller S?
(a)26: 21
(b)27: 19
(c)19: 27
(d)21: 26
(e)26: 27
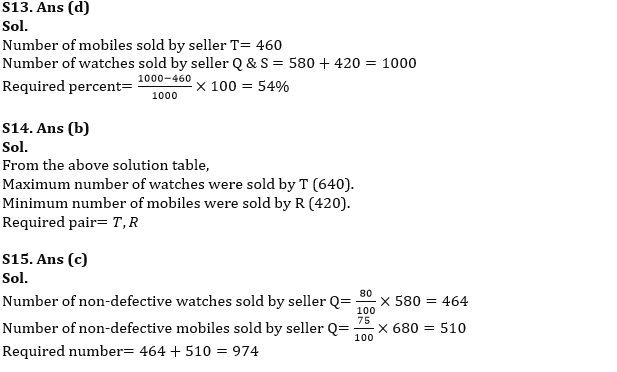
Q13. Find the total number of mobiles sold by seller T is what percent more or less than the number of watches sold by seller Q & S together?
(a)82%
(b)42%
(c)36%
(d)54%
(e)68%
Q14. Find the pair of sellers who sold maximum number of watches and minimum number of mobiles respectively?
(a)T, S
(b)T, R
(c)R, Q
(d)Q, P
(e)P, S
Q15. If 20% and 25% of the watches and mobiles respectively sold by seller Q are defective, then find the sum of number of non-defective watches and mobiles sold by seller Q?
(a)852
(b)940
(c)974
(d)888
(e)816
Solutions


 Data Interpretation Questions for IBPS R...
 Data Interpretation Questions For Bank E...
 Data Interpretation Questions for SBI PO...


