

Directions (1-5): The table given below shows the number of students appeared in Railway examination of Allahabad zone and percentage of students passed in the examination over the years.
Study the table carefully and answer the following questions.
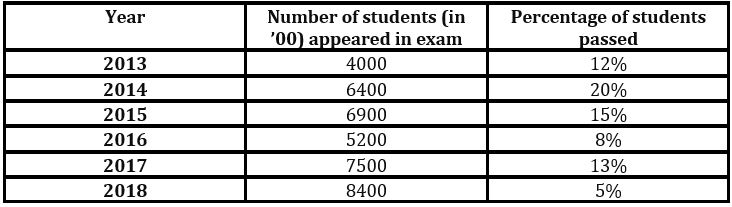
Q1. In which of the following year the no. of failed students is maximum?
(a) 2014
(b) 2016
(c) 2018
(d) 2017
(e) 2015
Q2. What is the average number of students passed in year 2013, 2015 and 2017?
(a) 92,000
(b) 83,000
(c) 87,000
(d) 79,000
(e) 81,000
Q3. Number of students passed in 2018 is how much percentage more or less than students passed in 2013?
(a) 12.5%
(b) 15%
(c) 17.5%
(d) 20%
(e) 10%
Q4. If in Chandigarh zone no. of students passed in 2018 are 6% of no. of students appeared in Allahabad zone in 2016 and no. of students failed are 80% of no. of students appeared in Allahabad zone in 2013, then find no. of students appeared in Chandigarh zone in 2018.
(a) 315200
(b) 321500
(c) 531200
(d) 253100
(e) 351200
Q5. Find the ratio between number of students passed in 2014 to the no. of students failed in 2013.
(a) 5 : 9
(b) 4 : 9
(c) 6 : 11
(d) 4 : 11
(e) 7 : 11
Directions (6-10): Study the bar chart given below and answer the following questions.
Bar chart shows the number of books (in ’000) sold by 6 different companies (A, B, C, D, E & F) in two different years (2017 & 2018).
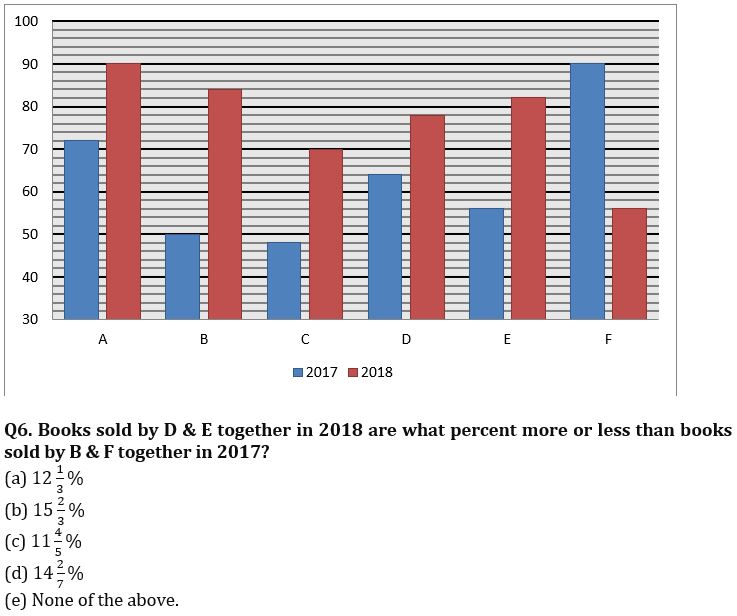
Q7. Find the ratio of books sold by A & C together in 2017 to books sold by E & F together in 2018?
(a) 20 : 23
(b) 15 : 16
(c) 3 : 8
(d) 10 : 17
(e) 4 : 5
Q8. Average number of books sold by A, B & D in 2017 are how much more or less than average number of books sold by C & E in 2018?
(a) 19000
(b) 14000
(c) 12000
(d) 20000
(e) 16000
Q9. Books sold by A, C & F together in 2017 are what percent of books sold by A, D & E together in 2018?
(a) 96%
(b) 88%
(c) 80%
(d) 95%
(e) 84%
Q10. Total books sold by all 6 companies in 2018 are what percent more or less than total books sold by all 6 companies in 2017?
(a) 40%
(b) 20%
(c) 50%
(d) 10%
(e) 30%
Directions (11-15) :- The given bar show shows the no. of Laptops sold by five companies (A, B, C, D and E) in two different years.
Study the given graph carefully and answer the following questions.
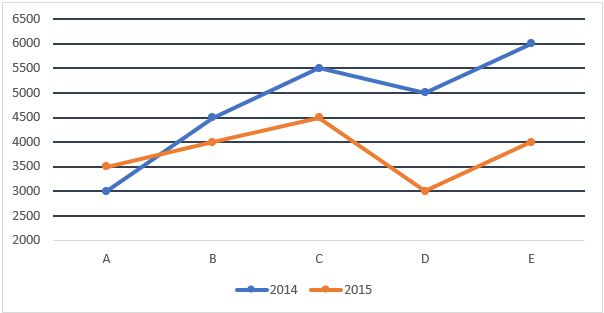
Q11. Find the average number of laptops sold in year 2014 by all the five companies?
(a) 4800
(b) 5200
(c) 5500
(d) 5600
(e) 5800
Q12. Laptops sold by company A in 2014 and B in 2015 together in what percent of laptops sold by company D and E together in 2015?
(a) 0%
(b) 50%
(c) 75%
(d) 100%
(e) 125%
Q13. What is the ratio between the laptops sold by company A, C and D in 2014 to that of company B and D in 2015?
(a) 23/14
(b) 27/14
(c) 2/1
(d) 29/14
(e) 14/27
Q14. Laptops sold by C and D together in 2014 is what percentage more than laptops sold by A and B in 2015?
(a) 44⅓%
(b) 41⅔%
(c) 40%
(d) 47⅓%
(e) 46⅓%
Q15. Total laptops sold in year 2014 is how much more/less than total laptops sold in year 2015?
(a) 2000
(b) 4000
(c) 6000
(d) 3000
(e) 5000
Solutions


 Data Interpretation Questions for IBPS R...
 Data Interpretation Questions For Bank E...
 Data Interpretation Questions for SBI PO...


