

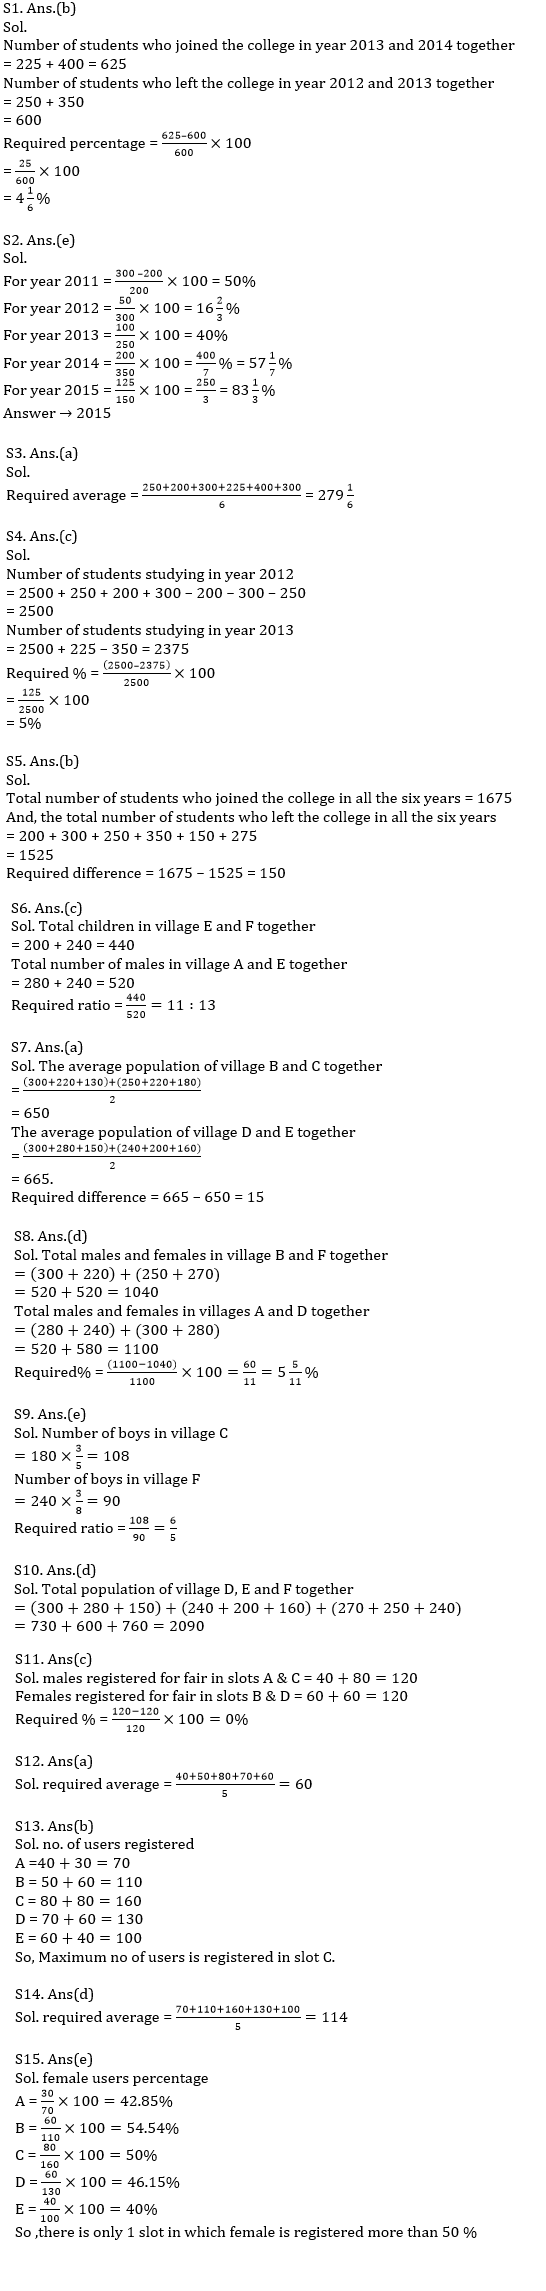
Directions (1-5): Study the following line graph which shows the number of students who joined and left the college in the beginning of year for six consecutive years from 2010 to 2015.
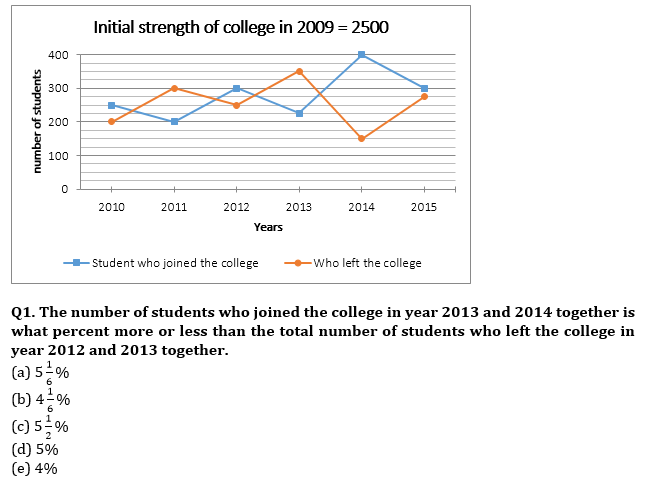
Q2. For which year, the percentage rise/fall in the number of students who left the college compared to the previous year is maximum?
(a) 2011
(b) 2012
(c) 2013
(d) 2014
(e) 2015
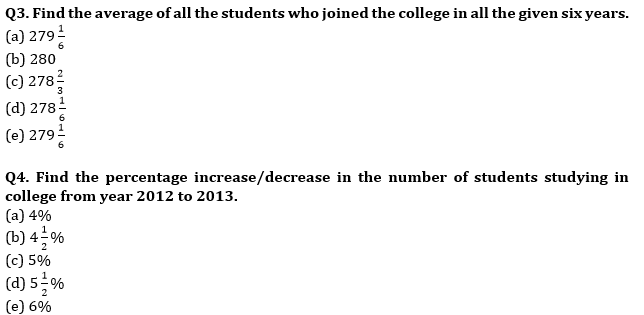
Q5. Find the difference between the total number of students who have joined the college during six years and the number of students who left the college during all the six years ?
(a) 125
(b) 150
(c) 100
(d) 135
(e) 140
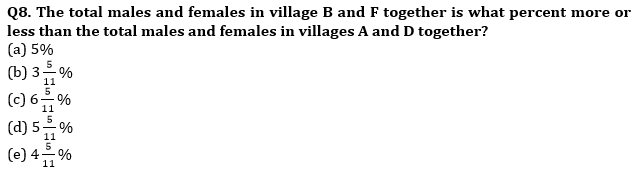
Direction (6–10) : Study the following line graph and answer the following questions. The given line graph shows the number of females, number of males and number of children in six different villages (A, B, C, D, E, and F).
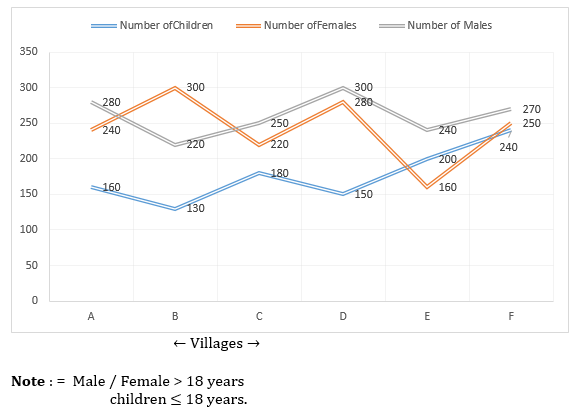
Q6. Find the ratio of the total children in village E and F together to the total number of males in village A and E together?
(a) 11 : 14
(b) 13 : 15
(c) 11 : 13
(d) 12 : 13
(e) 4 : 5
Q7. The average population of village B and C together is how much more/less than the average population of village D and E together.
(a) 15
(b) 20
(c) 25
(d) 12
(e) 10.
Q9. The ratio of boys and girls among the children in village C is 3 : 2 whereas the number of girls in village F is 62 ½% of the total children in that village. Then find the ratio of the number of boys in village C to the number of boys in village F.
(a) 5 : 6
(b) 7 : 5
(c) 5 : 7
(d) 5 : 4
(e) 6 : 5
Q10. Find the total population of village D, E and F together?
(a) 1990
(b) 2010
(c) 2030
(d) 2090
(e) 2070
Directions (11-15): Given radar graph shows the data of users (males & females) registered for a trade fair in 5 different slots. Study the data carefully and answer questions.
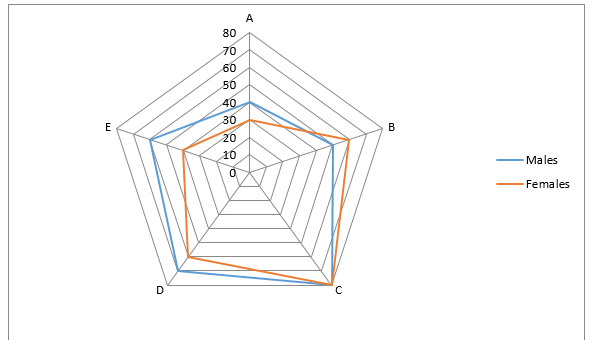
Q11. Males registered for fair in slots A & C together are what percent more/less than females registered for fair in slots B & D together?
(a) 4%
(b) 5%
(c) 0%
(d) 7%
(e) None of these
Q12. What is average number of male users registered for fair in all the slots?
(a) 60
(b) 65
(c) 55
(d) 70
(e) 75
Q13. In which slot, does the maximum no. of users registered for the fair?
(a) A
(b) C
(c) D
(d) B
(e) E
Q14. What is average no. of users in all the slots?
(a) 106
(b) 110
(c) 120
(d) 114
(e) 124
Q15. In how many slots, does the percentage of females registered in a slot over all users in same slot is more than 50%?
(a) None
(b) 2
(c) 4
(d) 3
(e) 1
Practice More Questions of Quantitative Aptitude for Competitive Exams:
Solutions
![]()

Click Here to Register for Bank Exams 2021 Preparation Material


 RBI Assistant Score Card 2026, Download ...
 IBPS Calendar 2026-27 Out @ibps.in for P...
 HPSCB Junior Clerk Exam Date 2026, Check...


