

Adda 247 will provide you daily Quantitative Aptitude Mock of “SBI PO Prelims. In today’s Quantitative Aptitude Mock, we have Bar Graph DI. Stay tuned with bankersadda to get Quantitative Aptitude Mock and boost your preparation for the upcoming bank exam. You can also prepare with the study plan for SBI PO available on the bankersadda website.
![]()
Direction (1-5): Following Bar Graph shows the production data of two Companies A and B in different years.
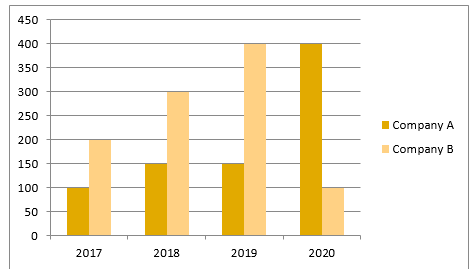
Q1. What is average production of company A in all the 4 years ?
(a) 100
(b) 200
(c) 300
(d) 150
(e) 225
Q2. Production of Company B in 2018 is what percent of total production in year 2020?
(a) 60%
(b) 75%
(c) 300%
(d) 150%
(e) 70%
Q3. What is difference between total production of Company A and Company B in all 4 years?
(a) 100
(b) 200
(c) 300
(d) 400
(e) 500
Q4.what is ratio of total production of company A in year 2018 and 2019 together and Company B in year 2018?
(a) 2:3
(b) 1:4
(c) 1:3
(d) 3:1
(e) 1:1
Q5. Total Production of Company B in all the years is how much percent more/less than the total production of Company A in all the years?
(a) 25%
(b) 20%
(c) 30%
(d) 10%
(e) 15%
| 6 June | Click to Attempt Now on Web | Click to Attempt Now on App | Download PDF |
Practice with Crash Course and Online Test Series for SBI PO Prelims:
- SBI PO Prime 2020 Online Test Series
- SBI PO KA MAHA PACK (Online Live Classes, Test Series, Video Courses, Ebooks in English Medium)
Register here to get study materials and regular updates!!


 SBI SCO Recruitment 2026, Last Date to A...
 World Bicycle Day 2026, Theme, History &...
 Daily Current Affairs Quiz 2nd June 2026...


