
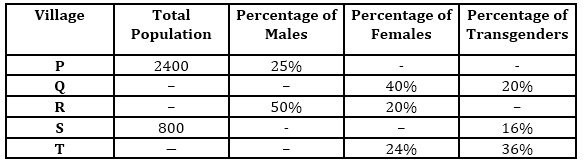
Directions (1-5): Refer to the table given below and answer the given questions.
Table shows the 5 villages and total population and percentage of males, females and transgenders in each village in year 2000. Some data are missing, find the missing data to answer the given questions.
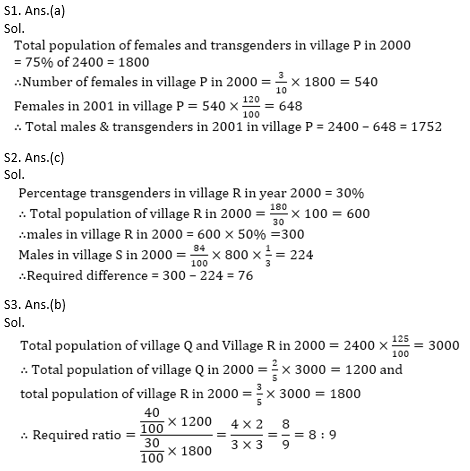
Q1. If the ratio of population of females and transgenders in village P in year 2000 is 3 : 7. And females in village P in year 2001 is increased by 20% from that of year 2000. Then find the total number of males and transgenders in village P in year 2001 so that overall population in year 2001 is same as in year 2000?
(a) 1752
(b) 1852
(c) 2752
(d) 3200
(e) None of these
Q2. If number of transgenders in village R in year 2000 is 180. And ratio of males and females in village S in year 2000 is 1:2. Then find the difference of males in village R and village S?
(a) 96
(b) 86
(c) 76
(d) 55
(e) None of these
Q3. If total population of village Q and village R together in year 2000 is 25% more than the total population of village P in year 2000. And ratio of total population of village Q and village R in year 2000 is 2 : 3. Then find the ratio of males in village Q to transgenders in village R in year 2000?
(a) 9 : 8
(b) 8 : 9
(c) 2 : 3
(d) 3 : 5
(e) None of these
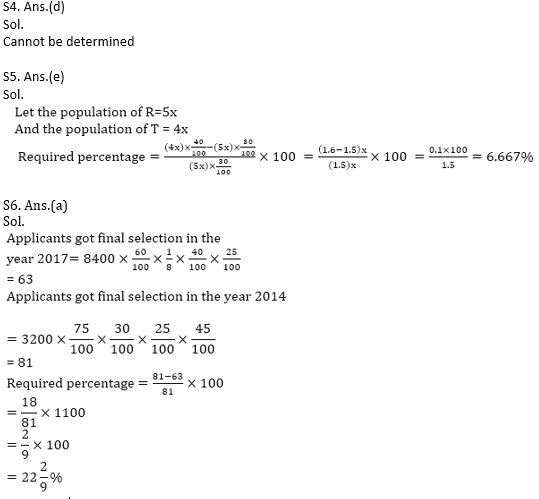
Q4. If ratio of males of village S in year 2000 to the females in village P in year 2000 is 2 : 5 and population of transgenders in village P is increased by 20% in year 2001 from year 2000. Then find the total population of transgenders in year 2001 in village P?
(a) 2000
(b) 1200
(c) 1500
(d) Cannot be determined
(e) None of these
Q5. If ratio of total population of village R to village T in year 2000 is 5: 4. Then number of males in village T in year 2000 is approximately what percent more or less than the number of transgenders in village R in year 2000?
(a) 5.667%
(b) 12%
(c) 10%
(d) 3.334%
(e) 6.667%
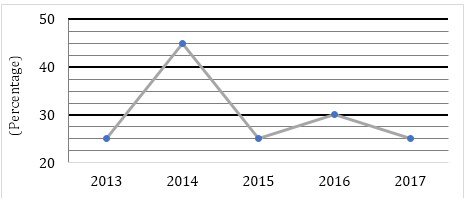
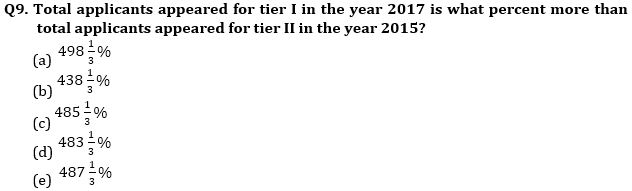
Directions (6-10): Table given below shows total number of applicants, who have applied for CDS exam in the five years. Percentage of applicants appeared in exam, percentage of applicants qualified in tier I and tier II. Line graph shows percentage of applicants got selection in CDS exam. Read the data carefully and answer the questions:
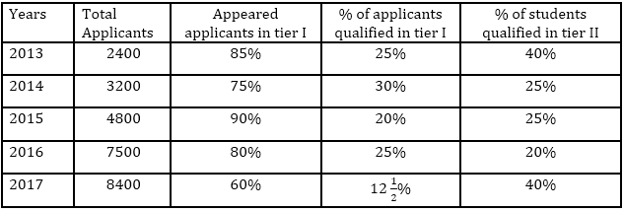
Note – All applicants qualified in tier I appeared for tier II.
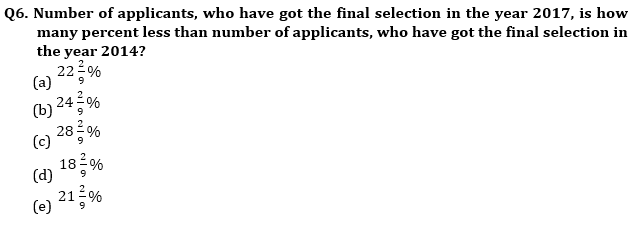
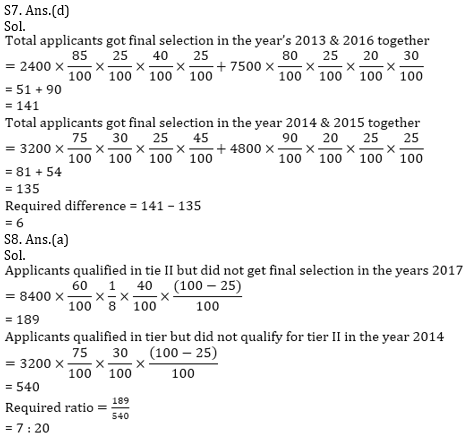
Q7. Find the difference between number of applicants, who have got final selection in the years 2013 & 2016 together and number of applicants, who have got final selection in the year 2014 & 2015 together?
(a) 5
(b) 8
(c) 3
(d) 6
(e) 11
Q8. Find the ratio between applicants qualified in tier II but did not get final selection in the year 2017 to applicants qualified in tier I but did not qualify for tier II in the year 2014?
(a) 7 : 20
(b)7 : 22
(c)7 : 19
(d)7 : 18
(e)7 : 16
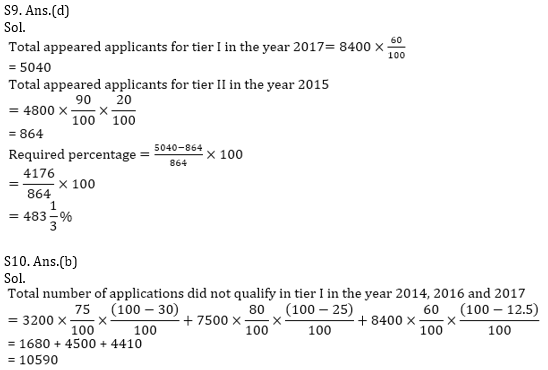
Q10. Find the total number of applicants, who did not qualify in tier I in the year 2014, 2016 & 2017 together?
(a) 10390
(b) 10590
(c) 10490
(d) 10290
(e) 10190
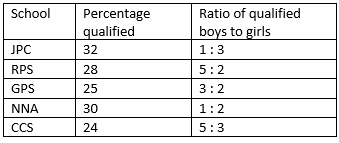
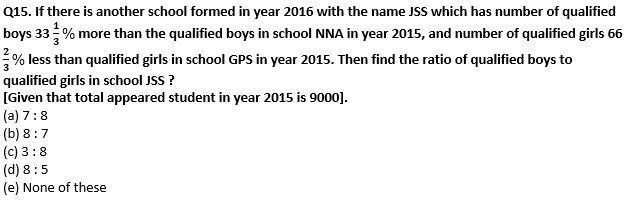
Directions (11-15): The pie chart given below shows the percentage of students appeared in different schools of same state in year 2015.
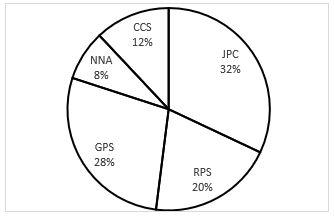
And the table given below shows the percentage of qualified students for different schools of same state in year 2015 and ratio of qualified boys to qualified girls.
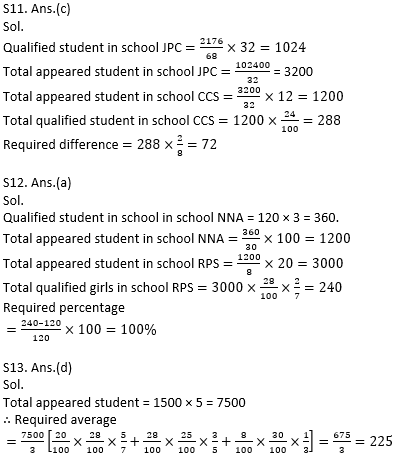
Q11. If unqualified student in school JPC is 2176. Then find the difference between qualified boys and girls in school CCS.
(a) 92
(b) 144
(c) 72
(d) 128
(e) 115
Q12. If qualified boys in school NNA is 120. Then qualified girls in school RPS is what percent more than the qualified boys in school NNA ?
(a) 100%
(b) 200%
(c) 50%
(d) 150%
(e) 80%
Q13. If the difference of appeared student of school CCS and JPC is 1500. Then find the average number of qualified boys of school RPS, GPS and NNA?
(a) 275
(b) 250
(c) 325
(d) 225
(e) 260
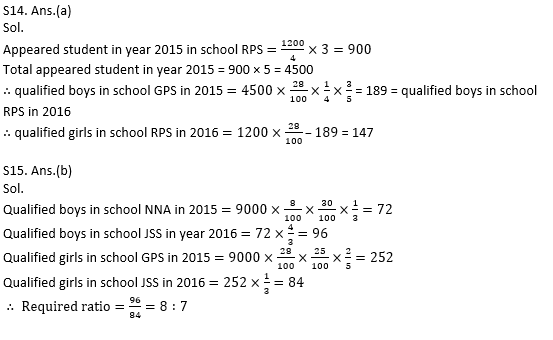
Q14. If the student appeared in 2016 of school RPS are 1200 which is 33⅓% more than those in 2015, and qualified boys in school RPS in 2016 is same as qualified boys in GPS in 2015. Then find the number of qualified girls in RPS in year 2016? [Given that percentage of qualified students in RPS are same in both years]
(a) 147
(b) 247
(c) 167
(d) 189
(e) None of these
Practice More Questions of Quantitative Aptitude for Competitive Exams:
Solutions
Practice with Crash Course and Online Test Series for IBPS Clerk Prelims:
- Bank Test Pack Online Test Series (12 Months)
- IBPS PO and Clerk Prime 2020-21 Online Test Series
- SBI PO Prime 2020-21 Online Test Series
Click Here to Register for Bank Exams 2020 Preparation Material


 CAIIB Admit Card 2026 Out, Direct Downlo...
 Daily Current Affairs and GK Updates (22...
 IB Security Assistant Interview Call Let...


